Igor Pro Graphics
Igor Pro graphics include the following features:
- Graphics Technology
- Graphics Features
- Graphs
- Category Plots
- Contour Plots
- Image Plots
- Page Layouts
- Annotations
- Pictures
- Subwindow User-Interface Concepts
- Notebooks as Subwindows in Control Panels
- Subwindow Command Concepts
- Exporting Graphics (Windows)
Graphics Technology
As of version 7, Igor Pro is based on the cross-platform Qt framework and, by default, Igor uses Qt for graphics. However, for special purposes, Igor provides access to platform-native graphics.
You should avoid native graphics and stick with Qt graphics if possible because it is the focus for future development. Native graphics is provided mainly for emergency use.
You can select native graphics on a global basis (all windows are affected) in two ways:
-
From the Miscellaneous category of the Miscellaneous Settings dialog (Misc→Miscellaneous Settings menu item).
-
By executing
SetIgorOption GraphicsTechnology=nwhere n is interpreted as follows:
| n = 0 | Default (currently Qt) | |
| n = 1 | GDI+ | |
| n = 2 | GDI | |
| n = 3 | Qt | |
Unlike most other SetIgorOption cases, this change is saved to preferences on disk and applies to future Igor sessions.
In addition to changing the global graphics technology setting, you can change individual windows using
SetWindow winName, graphicsTech=n
where n is the same as above. winName can be kwTopWin or the actual name of a window. Currently this setting is saved for graphs only but that is subject to change.
Over time, it is our intention that Qt graphics will replace the other technologies and the SetIgorOption GraphicsTechnology option may no longer be supported.
Graphics Technology on Windows
In general, you should use the the default graphics technology (GraphicsTechnology=0) which currently is Qt graphics. If you experience problems with graphics, you might try GraphicsTechnology=1 (GDI+) or 2 (GDI). High-resolution displays are supported in Qt graphics only.
GraphicsTechnology=1 utilizes the GDI+ interface. This provides support for transparency and other advanced features. Unfortunately, GDI+ is very slow, especially when rendering text.
If speed is an issue, you can try GraphicsTechnology=2 to use the older GDI interface. However, transparency is not honored - colors will be opaque regardless of the alpha value (see Color Blending for a discussion of alpha).
In GDI+ mode, EMF export uses a hybrid format, called "dual EMF", that contains both GDI+ and, for compatibility, the older GDI. In GraphicsTechnology=2 mode, only the older GDI-only style is exported. In Qt graphics mode, GDI+ is used for rendering the EMF for export, resulting in the dual EMF format. Some applications don't work well with EMF+ or dual EMF. In that case, try setting GraphicsTechnology=2 (old GDI mode) to export an EMF without the EMF+ component.
Our experience is that plain EMF is rendered better by GDI mode. In Qt graphics, the best rendering technology is chosen based on the contents of the picture you are pasting.
Regardless of the selected technology, exporting as EMF uses native interfaces.
SVG Graphics
In Qt mode (GraphicsTechnology=3), SVG (Scalable Vector Graphics) is available as an alternative object-based picture format. This can replace EMF and PDF whenever the destination program supports it. In Qt mode, other imported object-based pictures (EMF) are rendered as high-resolution bitmap images.
In native graphics modes, imported SVG pictures are rendered as high-resolution bitmap images using Qt graphics.
Regardless of the selected technology, exporting as SVG format is rendered using Qt.
High-Resolution Displays
High-resolution screen graphics is supported in Qt graphics technology mode only.
High-resolution displays, also called 4K, 5K, Ultra HD and Quad HD, bring a more pleasing visual experience but also present performance challenges. Depending on the operating system, graphics technology, and your actual data, graph updates can be thousands of times slower. This situation is expected to be temporary as operating systems optimize high-resolution graphics. See the Graphs and High-Resolution Displays topic in the release notes for the latest information.
On Windows, prior to Igor Pro 7, control panels were drawn using pixels for coordinates. Now, when the resolution exceeds 96 DPI, those coordinates are taken to be points. This prevents panels from appearing tiny on high-resolution displays. See Control Panel Resolution on Windows for more information.
Graphs and High-Resolution Displays
High-resolution displays bring a more pleasing visual experience, but also present performance challenges. Previously, one point lines were one pixel wide. Now, on high-resolution displays, such lines are two pixels wide and, depending on the operating system, graphics technology and the actual data, drawing can be thousands of times slower.
Since Igor Pro 8, we now use fast custom code when drawing lines that are two or more pixels wide. However, because the custom code lines are not as pleasing as the system code, it is used only under conditions where the system code is slow, particularly when very long traces are used.
When you need the fastest update speed, you can specify that a trace should use the fast line draw code by using the ModifyGraph live keyword with a value of 2. This will cause even one pixel thick lines to be drawn with the new code. The speed improvement is on the order of a factor of two.
You can use the Live Mode demo experiment to see how different settings affect the speed of graph updates.
Open Live Mode Experiment now.
Windows High-DPI Recommendations
High-DPI (dots-per-inch) displays have resolutions substantially higher than the Windows standard 96 DPI. These displays sometimes go by the names Retina, 4K, 5K, Ultra HD and Quad HD.
Since the pixels of a high-DPI monitor are typically about one-half the size of pixels on standard monitors, software running on a high-DPI monitor must make adjustments. These adjustments are made by some combination of the operating system and the program itself.
Both the operating system and the Qt framework that Igor uses introduce complexities that sometimes result in less than perfect behavior. This section provides guidance for Windows user to minimize these issues.
To get the best experience when using a high-DPI display, we recommend that you use Windows 10 or later. We do not test or explicitly support high-DPI features on older Windows versions.
If you only have one display, such as a laptop with a high-DPI display, and no external displays are connected, you should not need to make any changes to Igor's default configuration to achieve the correct behavior.
If you have multiple displays with different resolutions, such as a high-resolution laptop display and a standard-resolution external monitor, you may see problems such as text, menus, windows or icons too big or too small. In our experience with Igor 8, most or all of these issues are resolved if you make your high-resolution display your main display using the Windows 10 Display control panel.
As an example, here are instructions for configuring a typical mixed-resolution system - a laptop with a built-in high-resolution display and an external standard-resolution monitor:
-
Connect the external standard-resolution monitor.
-
Open the Display settings page. You can do this by right-clicking the Start menu, choosing Settings, clicking System, and selecting Display in the lefthand pane.
-
In the Multiple Displays setting, near the bottom of the pane, select Extend These Displays.
-
Click the Identify link below the diagram of your displays at the top of the pane to confirm which display is which. For these instructions, we assume that display #1 is the high-resolution built-in display and display #2 is a standard-resolution external monitor.
-
Click the box representing the built-in high-resolution display (display #1 for this example).
-
Set Resolution to the recommended value, such as 3840 x 2160.
-
Set Scale and Layout to the recommended value, which may be 200%, 225%, or 250% depending on your hardware.
-
Check the Make This My Main Display checkbox near the bottom of the pane.
-
Close the settings control panel.
-
Reboot your machine twice.
To get the best results, you must reboot your machine 2 times after any changes to the display settings.
-
After your machine restarts twice, start Igor. Except for occasional minor glitches, it should work properly.
If the preceding instructions do not give useable results, you may find it necessary to fall back to standard resolution for the high-resolution display. To do this, set Resolution to standard resolution and set Scale and Layout to 100%. Standard resolution is usually half the recommended resolution - for example 1920 x 1080 instead of 3140 x 2160. If you do this, you can make either display the main display.
Graphics Features
This section discusses general graphics features that are used in graphs, page layout windows and drawing layers.
Dashed Lines
You can display traces in graphs, as well as drawn lines, rectangles, ovals, and polygons, using various line styles. This table, generated from the ColorsMarkersLinesPatterns.pxp example experiment, shows Igor's default line styles:
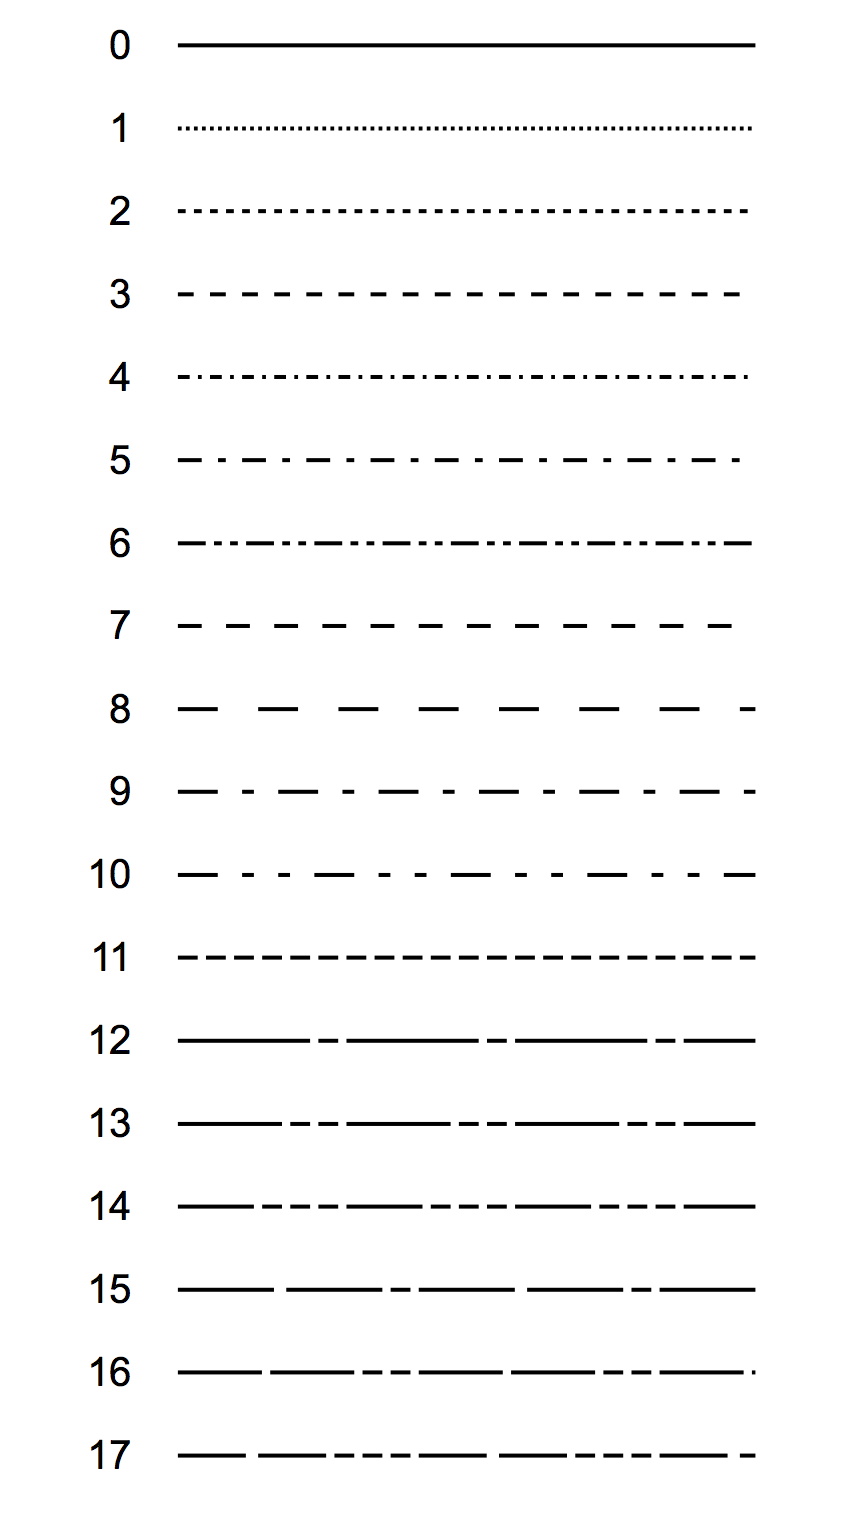
It is usually not necessary, but you can edit the built-in dashed line styles using the Dashed Lines Dialog by choosing Misc→Dashed Lines.
Dashed line 0 (the solid line) cannot be edited. If you need to create a custom dashed line pattern, we recommend that you modify the high numbered dashed lines, leaving the low number ones in their default state. This ensures that the low numbered patterns will be the same for everyone.
You can also change dashed lines with the SetDashPattern operation.
Dashed lines are stored with the experiment, so each experiment can have different dashed lines. You can capture the current dashed lines as the preferred dashed lines for new experiments.
Line Join and End Cap Styles
When graph traces or drawn lines are very wide, you may want to control the appearance of the joins between line segments and the ends of line segments. The ModifyGraph lineJoin keyword provides control of line joins for graph traces in lines-between-points mode. The SetDrawEnv lineJoin keyword provides control for drawn lines.
Line joins can have miter, round or bevel styles. For a miter join, you can specify the miter limit to control the length of miters on very acute angles. In these pictures, the blue dots show the position of the ends and join points of the lines:
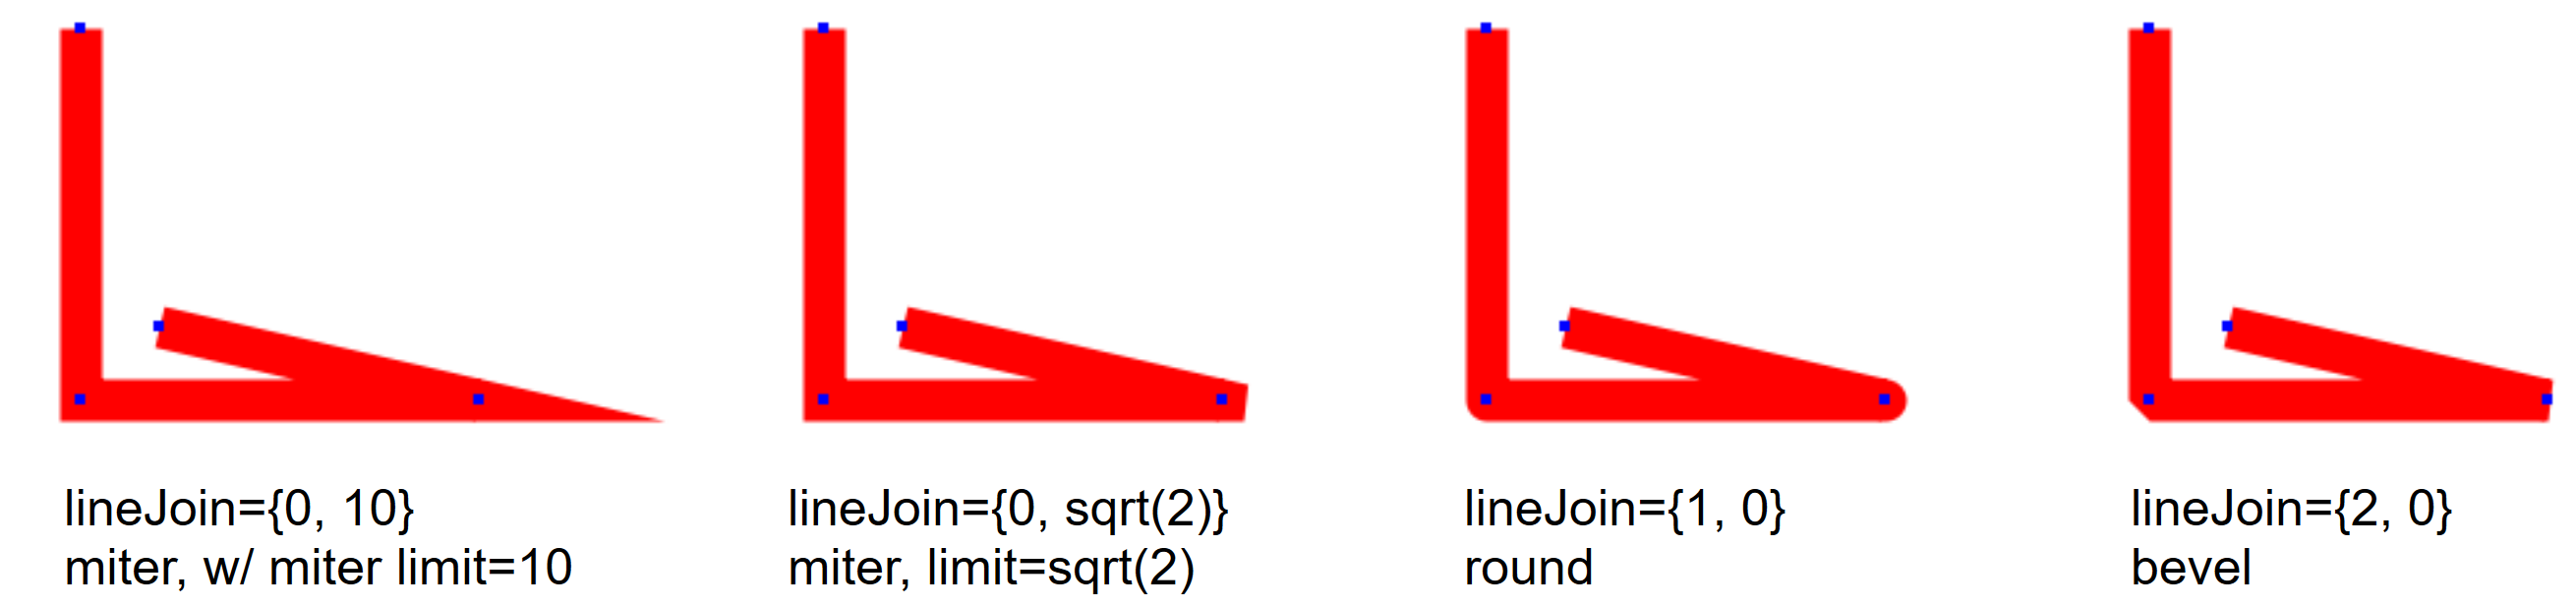
Miter joins extend the outside edges of the line segments until they intersect. Acute angles may result in very long miters. Round joins draw a circular arc around the join point, and bevel joins truncate the intersection with a bevel at the intersection point.
You can set the miter limit to avoid very long miter extensions:
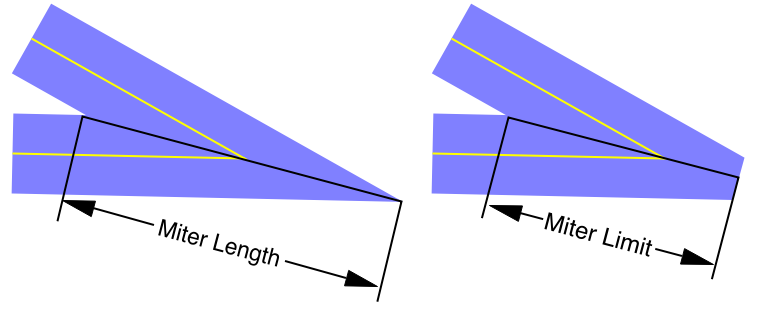
When the miter limit is sqrt(2), any line join that is more acute than 90 degrees is truncated. Unfortunately, the nature of the truncation depends on the Graphics Technology. GDI, PDF and Postscript truncate the miter by reverting to a bevel join; Qt graphics and GDI+ truncate the miter by beveling at the miter limit. If you export graphics using a bitmap format such as PNG or JPG, the miter limit is controled by the graphics technology you have chosen (usually Qt graphics) in the Miscellaneous Settings dialog. The second picture above was drawn with Qt graphics as a PNG bitmap; the very acute intersection is truncated at the miter limit.
You can control the way line ends are drawn using ModifyGraph lOptions keyword, or for drawn lines using SetDrawEnv lineCap.
Line caps can be flat, round or square. These pictures show the appearance of each option; the dots show where the geometric end of each line is:
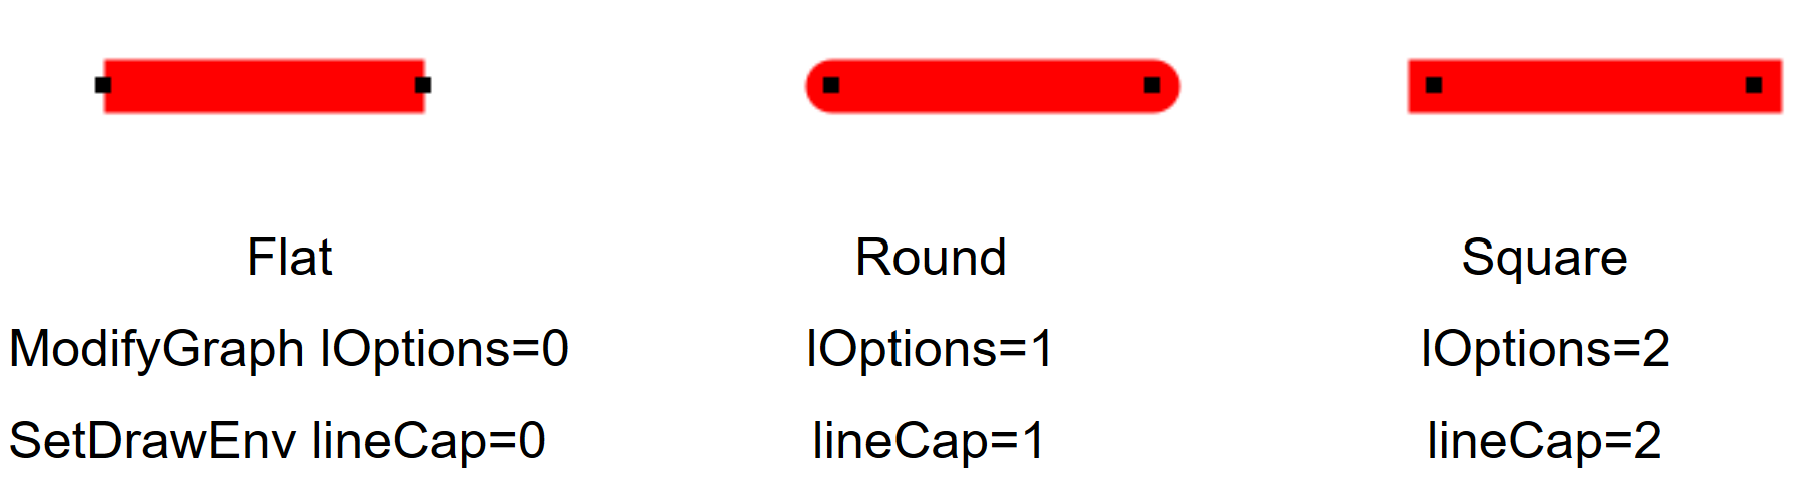
The end cap style is applied at the end of each segment of a dashed line:

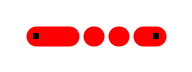
Square end caps extend the square end of the line beyond the geometric end and in Igor are probably not useful.
The Color Environment
Igor has a main color palette that contains colors that you can use for traces in graphs, text, axes, backgrounds and so on. The main color palette appears as a pop-up menu in a number of dialogs, such as the Modify Trace Appearance dialog. This section discusses this palette.
Igor also has color tables and color index waves you can select among when displaying contour plots and images. These are discussed in Contour Plots and Image Plots.
You can select a color from the colors presented in a color palette:
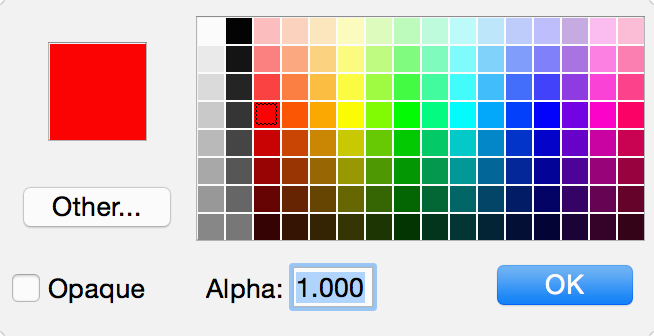
You can use the Other button to select colors that are not in the palette. As you use Igor, colors are added to the palette in the Recent Colors area.
The recent colors are remembered by Igor when it quits and restored when it restarts if you have selected the "Save and restore color palette's recent colors" checkbox in the Miscellaneous Settings dialog's Color Settings category.
Color Blending
In places where you can supply a color in RGB format, you can optionally provide a fourth parameter called "alpha". Alpha, like the R, G and B values, can range from 65535 (100% opaque) down to 0 (100% transparent). Intermediate values provide translucency. For example:
Make jack=sin(x/8),sam=cos(x/6); Display jack, sam
ModifyGraph mode=7,hbFill=2
ModifyGraph rgb(jack)=(65535,32768,32768)
ModifyGraph rgb(sam)=(0,0,65535,40000)		// Translucent
Color blending was added in Igor Pro 7.
Color blending does not work on Windows in the old GDI graphics mode explained under Graphics Technology on Windows.
Color blending does not work in graphics exported as EPS. Use PDF instead.
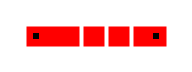
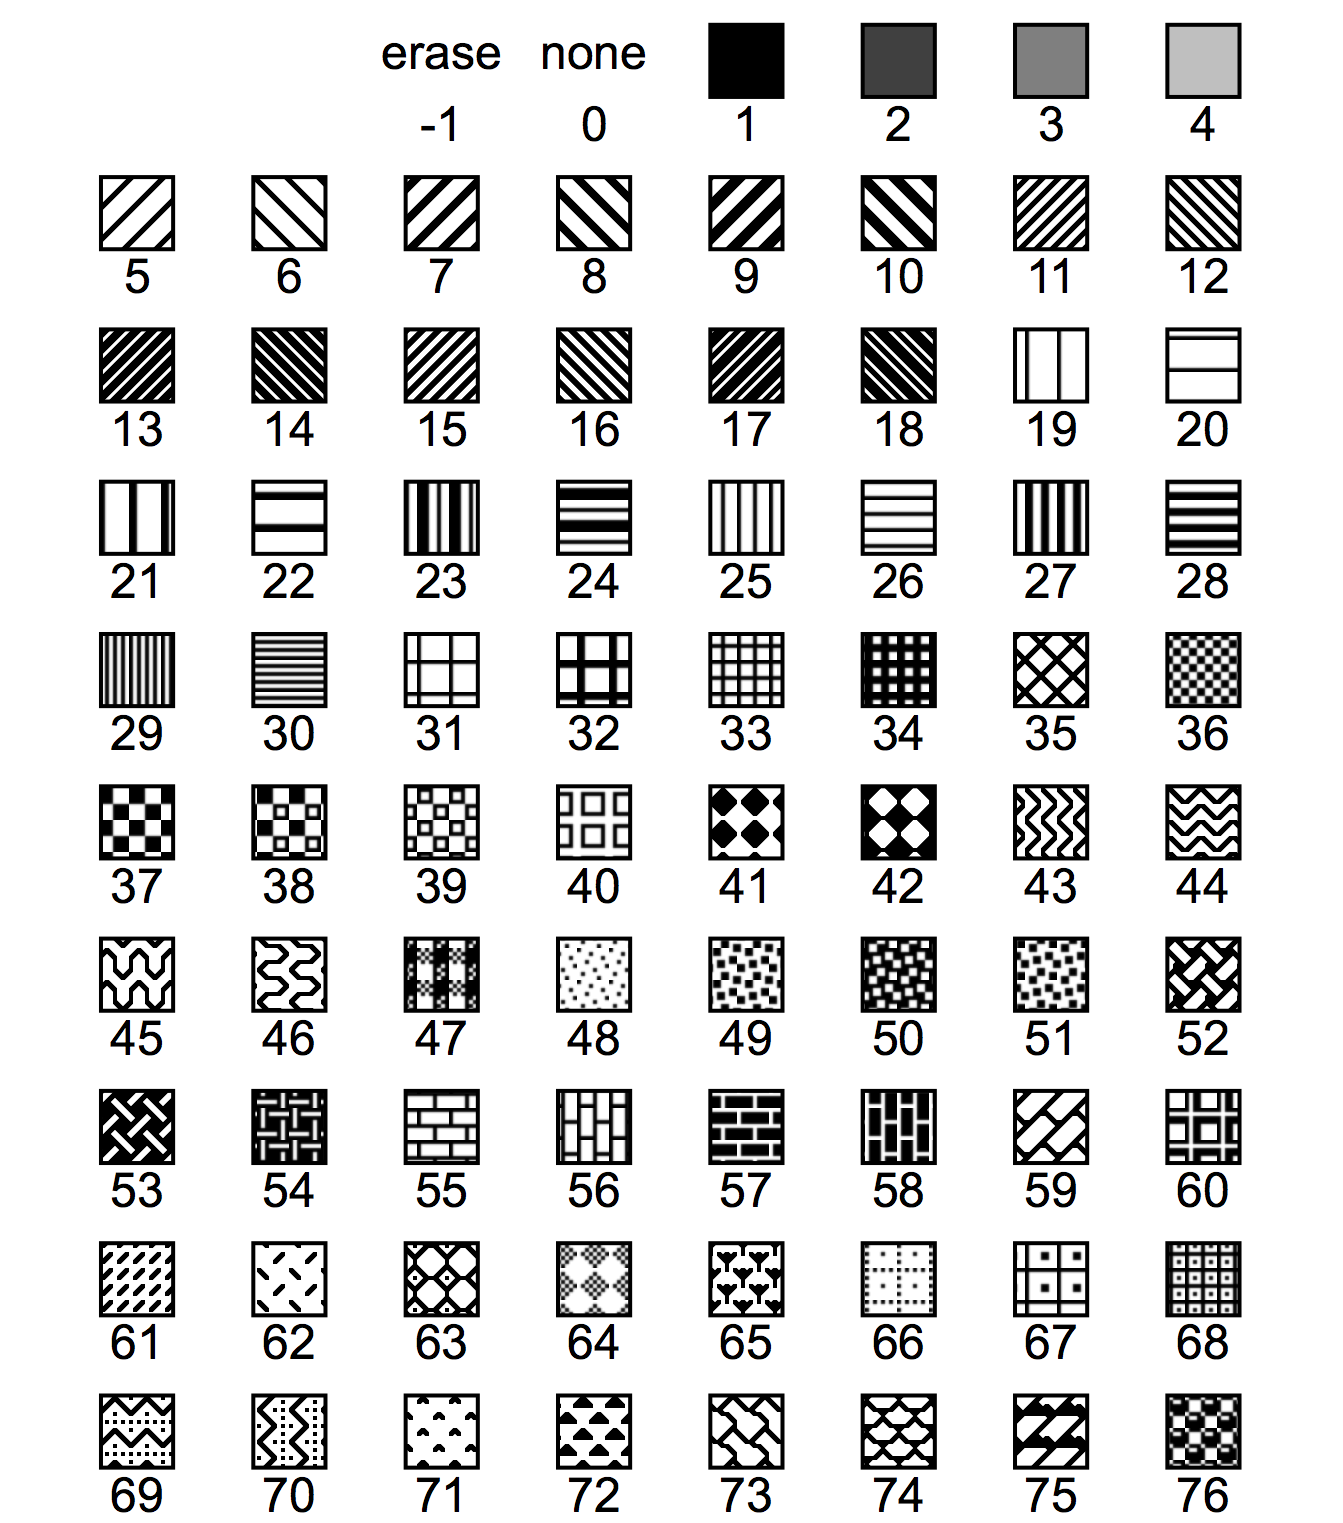
Fill Patterns
Fill patterns can be used in graphs and drawing layers. This table, generated from the ColorsMarkersLinesPatterns.pxp example experiment, shows the available fill patterns.
The fill pattern codes shown below are appropriate for drawing commands. For graph-related commands, such as ModifyGraph hbFill, make the following adjustments:
-
Erase is 1 instead of -1
-
Add 1 to all pattern codes greater than 0
Gradient Fills
You can specify gradient fills for drawing elements, graph trace fills, and graph window and plot area background fills. A gradient fill is a gradual change of color.
Programmatically you specify gradients using two keywords, gradient and gradientExtra, when calling the ModifyGraph, ModifyLayout or SetDrawEnv operations.
The syntax for the gradient keyword has two forms. The first form provides overall control of the gradient while the second form controls the color details.
The first form for the gradient keyword is:
gradient = 0, 1, 2, or 3
0 deletes the gradient entirely.
1 turns on an existing gradient or creates a new one with default values.
2 turns off a gradient but keeps the settings.
3 is used in combination with the ModifyLayout operation and signals that a particular page should not display a gradient even when a layout global gradient is set.
The second form for the gradient keyword is:
gradient = {type , x0 , y0 , x1 , y1 [,color0 [, color1 ] ]}
type is a bitfield.
Bits 0 through 3 specify the gradient mode. 0 is linear, 1 is radial and other values are reserved.
Bits 4 through 7 specify the coordinate mode. 0 is object rect, 1 is window rect.
To construct a type parameter signifying a radial gradient in window rect mode you could write:
Variable gradientType = 1 | (1*16)
The following commands illustrate the difference between object rect and window rect mode. Execute these commands and then drag the rectangles around:
Display /W=(150,50,474,365)
SetDrawLayer UserFront
SetDrawEnv xcoord=abs,ycoord=abs
SetDrawEnv save
SetDrawEnv fillfgc=(16385,16388,65535),fillbgc=(65535,16385,16385)
SetDrawEnv gradient={16, 0, 0, 1, 1}					// Window rect mode
DrawRect 25,38,95,138
SetDrawEnv gradient={1, 0.5, 0.5, 0, 1, (0,65535,0), (65535,0,65535)}	// Object rect mode
DrawRect 130,150,273,289
ShowTools/A
The x0 , y0 , x1 , and y1 parameters specify normalized locations that define the gradient. (0,0) is the upper left corner of the bounding rectangle while (1,1) is the lower right corner. For a linear gradient, (x0 , y0 ) defines the start while (x1 , y1 ) defines the end. Only the slope of the line is used, not the actual extent. For a radial gradient, (x0 , y0 ) defines the center of a bounding circle while (x1 , y1 ) is not used at present.
The optional color0 and color1 keywords are specified as (r,g,b) or (r,g,b,a) but use of alpha is not fully supported on all platforms. When omitted or with a value of (0,0,0) the actual color used is a default for the given circumstance. The default values are specified in the individual operation documentation.
The gradientExtra keyword adds an additional color change point. You can add as many change points as desired.The syntax for the gradientExtra keyword is:
gradientExtra = {loc , color }
loc is in the range 0.0 to 1.0. Values of exactly 0 or 1 replace the original color0 or color1 values as specified by the gradient keyword.
color is specified as (r,g,b) or (r,g,b,a) but use of alpha is not fully supported on all platforms.
The following operations support the gradient and gradientExtra keywords.
-
If you specify a gradient it overrides the fill for drawing elements.
If you omit the color0 parameter or specify (0,0,0,0) then the current pattern background color is used.
If you omit the color1 parameter or specify (0,0,0,0) then the current foreground color is used.
All gradientExtra keywords must be on the same line as the gradient keyword itself.
-
You can specify gradients for individual pages by combining the gradient and gradientExtra keywords with the /PAGE=pageNum flag.
Page numbers start from 1. Use /PAGE=0 to use the currently active page.
/PAGE=-1 causes the operation to modify the layout global gradient which applies to any pages in the targeted page layout for which no explicit gradient has been set.
-
If you specify a gradient it overrides the fill for traces.
The gradient and gradientExtra keywords apply to all traces unless you specify a trace name like this:
gradient(<trace name>) = {...}
gradientExtra(<trace name>) = {...}
If you omit the color0 parameter or specify (0,0,0,0) then the current pattern background color is used.
If you omit the color1 parameter or specify (0,0,0,0) then the plusRGB color is used.
When the type parameter specifies a window rect, the plus and neg areas are used automatically and the color1 is away from the zero level.
-
The wbGradient and wbGradientExtra keywords control the window background gradient, if any.
The gbGradient and gbGradientExtra keywords control the graph plot area background gradient, if any.
The "Demo Experiment #1" and "Demo Experiment #2" example experiments demonstrate these gradients. You can turn the on and off using the Macros menu.
Exporting Graphics (Windows)
This section discusses exporting graphics from Igor graphs, page layouts, tables, and Gizmo plots to another program on Windows. You can export graphics through the clipboard by choosing Edit→Export Graphics, or through a file, by choosing File→Save Graphics.
Igor Pro supports a number of different graphics export formats. You can usually obtain very good results by choosing the appropriate format, which depends on the nature of your graphics, your printer and the characteristics of the program to which you are exporting.
Unfortunately, experimentation is sometimes required to find the best export format for your particular circumstances. This section provides the information you need to make an informed choice.
This table shows the available graphic export formats on Windows:
| Export Format | Export Method | Notes |
|---|---|---|
| EMF (Enhanced Metafile) | Clipboard, file | Windows-specific vector format. |
| BMP (Bitmap) | Clipboard, file | Windows-specific bitmap format. |
| Does not use compression. | ||
| Clipboard, file | Platform-independent and high quality. | |
| Igor PDF with CMYK color does not support transparency. | ||
| EPS (Encapsulated Postscript) | File only | Platform-independent except for the screen preview. |
| Supports high resolution. | ||
| EPS does not support transparency. | ||
| Useful only when printing on PostScript printer, creating a PDF file or exporting to PostScript-savvy program (e.g., Adobe Illustrator, Tex). | ||
| PNG (Portable Network Graphics) | Clipboard, file | Platform-independent bitmap format. |
| Uses lossless compression. Supports high resolution. | ||
| JPEG | Clipboard, file | Platform-independent bitmap format. |
| Uses lossy compression. Supports high resolution. | ||
| PNG is a better choice for scientific graphics. | ||
| TIFF | Clipboard, file | Platform-independent bitmap format. |
| Igor's implementation currently does not use compression. Supports high resolution. | ||
| SVG | Clipboard, file | Platform-independent 2D vector and raster graphics format. A good choice if the destination program supports SVG. As of this writing, few Windows programs support SVG. |
Metafile Formats
The metafile formats are Windows vector graphics formats that support drawing commands for the individual objects such as lines, rectangles and text that make up a picture. Drawing programs can decompose a metafile into its component parts to allow editing the individual objects. Most word processing programs treat a metafile as a black box and call the operating system to display or print it.
Enhanced Metafile (EMF) is the primary Windows-native graphics format. It comes in two flavors: the older plain EMF and a newer EMF+. Igor exports "dual EMF" by default. A dual EMF contains both a plain EMF and an EMF+; applications that don't support EMF+ will use the plain EMF component. EMF+ is needed if transparency (colors with an alpha channel) is used. You can export using the older EMF format if the destination program does not work well with EMF+ (see Graphics Technology for details).
EMF is easy to use because nearly all Windows programs can import it and because it can be copied to the clipboard as well as written to a file. Some programs, notably some older versions of Microsoft Office, require that you choose Paste Special rather than Paste to paste an EMF from the clipboard.
Although drawing programs can decompose an EMF into its component parts to allow editing the individual objects, they often get it wrong due to the complexity of the metafile format. Some applications that decompose an EMF correctly are confused by the dual EMF. For such programs, you need to export a plain EMF by setting the graphics technology to GDI.
BMP Format
BMP is a Windows bitmap format. It is accepted by a wide variety of programs but requires a lot of memory and disk space because it is not compressed. A BMP is also known as a DIB (device-independent bitmap).
If the program to which you are exporting supports PNG then PNG is a better choice.
PDF Format (Windows)
PDF (Portable Document Format) is Adobe's platform-independent vector graphics format. This is the best format as long as your destination program supports it.
The Igor PDF format is generated by Igor's own code rather than by the OS. As of Igor Pro 9, Igor PDF supports transparency and does a better job of font embedding. However, if you request CMYK color, the older code is used.
When Igor exports graphics as PDF on Windows, any pictures, including PDF pictures, imported into Igor are exported as bitmap images.
Blurry Images in PDF (Windows)
When Igor exports an image plot, it exports the image as a single image object when possible. However, some PDF viewers, most notably Apple's, take it upon themselves to blur the pixels. To get around this, you can tell Igor to draw image pixels as individual rectangles using the ModifyImage interpolate keyword with a value of -1. You should do this only when necessary as the resulting PDF will be much larger.
Encapsulated PostScript (EPS) Format (Windows)
Encapsulated PostScript was a widely-used, platform-independent vector graphics format consisting of PostScript commands in plain text form. EPS is largely obsolete, but is still in use. It usually gives good quality, but it works only when printed to a PostScript printer or exported to a PostScript-savvy program such as Adobe Illustrator. You should use only PostScript fonts such as Helvetica. EPS does not support tranparency.
Prior to Igor Pro 7, Igor embedded a screen preview in EPS files. That is no longer done because the preview was not cross-platform and caused problems with many programs.
EPS files normally use the RGB encoding to represent color but you can also use CMYK. See Exporting Colors (Windows) for details.
Igor Pro exports EPS files using PostScript language level 2. This allows much better fill patterns when printing and also allows Adobe Illustrator to properly import Igor's fill patterns. For backwards compatibility with old printers, you can force Igor to use level 1 by specifying /PLL=1 with the SavePICT operation.
If the graph or page layout that you are exporting as EPS contains a non-EPS picture imported from another program, Igor exports the picture as an image incorporated in the output EPS file.
Igor can embed TrueType fonts as outlines. See Font Embedding (Windows) and Symbols with EPS and Igor PDF for details.
SVG Format
SVG (Scalable Vector Graphics) is an XML-based platform-independent 2D vector and raster graphics format developed by the World Wide Web Consortium. It is often used for displaying graphics in web pages and is a good choice for other uses if the destination program supports it. As of this writing, Microsoft Office supports SVG, but few other Windows programs support it.
Platform-Independent Bitmap Formats (Windows)
PNG (Portable Network Graphics) is a platform-independent bitmap format. It uses lossless compression and supports high resolution. It is a superior alternative to JPEG or GIF. Although Igor can export and import PNG images via files and via the clipboard, some programs that allow you to insert PNG files do not allow you to paste PNG images from the clipboard.
JPEG is a lossy format whose main virtue is that it is accepted by all web browsers. However, all modern web browsers support PNG so there is little reason to use JPEG for scientific graphics. Although Igor can export and import JPEG via the clipboard, most Windows programs cannot paste JPEGs, but Microsoft Office can.
TIFF is an Adobe format often used for digital photographs. Igor's implementation of TIFF export does not use compression. TIFF files normally use the RGB scheme to specify color but you can also use CMYK. See Exporting Colors (Windows) for details. There is no particular reason to use TIFF over PNG unless you are exporting to a program that does not support PNG. Igor can export and import TIFF via files and via the clipboard and most graphics programs can import TIFF.
Choosing a Graphics Format (Windows)
Because of the wide variety of types of graphics, destination programs, printer capabilities, operating system behaviors and user-priorities, it is not possible to give definitive guidance on choosing an export format. But here is an approach that will work in most situations.
PNG is a the recommended choice for exporting image plots and Gizmo plots which are inherently bitmaps.
If the destination program accepts PDF or SVG, then they are probably your best choice because of their high-quality vector graphics and platform-independence.
Encapsulated PostScript (EPS) is also a very high quality format which works well if the destination program supports it, but it does not support transparency.
If PDF, SVG, and EPS are not appropriate, your next choice for vector graphics would be a high-resolution bitmap. The PNG format is preferred because it is platform-independent and supports lossless compression.
Exporting Graphics Via the Clipboard (Windows)
To export a graphic from the active window via the clipboard, choose Edit→Export Graphics. This displays the Export Graphics dialog.
When you click the OK button, Igor copies the graphics for the active window to the clipboard. You can then switch to another program and do a paste.
When a graph, page layout, or Gizmo plot is active and in operate mode, choosing Edit→Copy copies to the clipboard whatever format was last used in the Export Graphics dialog. For a table, Edit→Copy copies the selected numbers to the clipboard and does not copy graphics.
When a page layout has an object selected or when the marquee is active, choosing Edit→Copy copies an Igor object in a format used internally by Igor along with an enhanced metafile and does not use the format from the Export Graphics dialog.
Although Igor can export a number of different formats, not all programs can recognize them on the clipboard. You may need to export via a file.
Exporting Graphics Via a File (Windows)
To export a graphic from the active window via a file, choose File→Save Graphics. This displays the Save Graphics File dialog.
The controls in the Format area of the dialog change to reflect options appropriate to each export format.
When you click the Do It button, Igor writes a graphics file. You can then switch to another program and import the file.
If you select _Use Dialog_ from the Path pop-up menu, Igor presents a Save File dialog in which you can specify the location and name of the saved file.
Exporting a Section of a Layout (Windows)
To export a section of a page layout, use the marquee tool to identify the section and then choose Edit→Export Graphics or File→Save Graphics.
If you don't use the marquee and the Crop to Page Contents checkbox is checked, Igor exports the area of the layout that is in use plus a small margin. If it is unchecked, Igor exports the entire page.
Exporting Colors (Windows)
The EPS and TIFF graphics formats normally use the RGB scheme to specify color. Some publications require the use of CMYK instead of RGB, although the best results are obtained if the publisher does the RGB to CMYK conversion using the actual characteristics of the output device. For those publications that insist on CMYK, you can use the SavePICT /C=2 flag.
Font Embedding (Windows)
This section is largely obsolete. It applies only to EPS files and PDF files generated for CMYK colors. Even then you need this info only in unusual circumstances.
You can embed TrueType fonts in EPS files and in PDF files. This means that you can print EPS or PDF files on systems lacking the equivalent PostScript fonts. This also helps with publications that require embedded fonts.
Font embedding is always on and the only option is to not embed standard fonts. For most purposes, embedding only non-standard fonts is the best choice.
Igor embeds TrueType fonts as synthetic PostScript Type 3 fonts derived from the TrueType font outlines. Only the actual characters used are included in the fonts.
Not all fonts and font styles on your system can be embedded. Some fonts may not allow embedding and others may not be TrueType or may give errors. Be sure to test your EPS files on a local printer or by importing into Adobe Illustrator before sending them to your publisher. You can also use the "TrueType Outlines.pxp" example experiment to validate fonts for embedding (Open TrueTypeOutlines Experiment).
For EPS, Igor determines if a font is non-standard by attempting to look up the font name in a table described in PostScript Font Names (Windows) after doing any font substitution using that table. In addition, if a nonplain font style name is the same as the plain font name, then embedding is done. This means that standard PostScript fonts that do not come in italic versions (such as Symbol), will be embedded for the italic case but not for the plain case.
For PDF, non-standard fonts are those other than the basic fonts guaranteed by the PDF specification to be built-in to any PDF reader. Those fonts are Helvetica and TImes in plain, bold, italic, and bold-italic styles as well as plain versions of Symbol and Zapf Dingbats. If embedding is not used or if a font cannot be embedded, fonts other than those just listed will be rendered as Helvetica and will not give the desired results.
PostScript Font Names (Windows)
When generating PostScript, Igor needs to generate proper PostScript font names. This presents problems under Windows. Igor also needs to be able to substitute PostScript fonts for non-PostScript fonts. Here is a list of font names that are translated into the standards:
| TrueType Name | PostScript Name |
|---|---|
| Arial | Helvetica |
| Arial Narrow | Helvetica-Narrow |
| Book Antiqua | Palatino |
| Bookman Old Style | Bookman |
| Century Gothic | AvantGarde |
| Century Schoolbook | NewCenturySchlbk |
| Courier New | Courier |
| Monotype Corsiva | ZapfChancery |
| Monotype Sorts | ZapfDingbats |
| Symbol | Symbol |
| Times New Roman | Times |
Pictures
Igor can import pictures from other programs for display in graphs, page layouts and notebooks. It can also export pictures from graphs, page layouts and tables for use in other programs. Exporting is discussed in Exporting Graphics (Windows). This section discusses how you can import pictures into Igor, what you can do with them and how Igor stores them.
For information on importing images as data rather than as graphics, see Loading Image Files.
Importing Pictures
There are three ways to import a picture.
-
Paste from the Clipboard into a graph, layout or notebook.
-
Use the Pictures dialog (Misc menu) to import a picture from a file or from the Clipboard.
-
Use the LoadPICT operation to import a picture from a file or from the Clipboard.
Each of these methods, except for pasting into a notebook, creates a named, global picture object that you can use in one or more graphs or layouts. Pasting into a notebook creates a picture that is local to the notebook.
This table shows the types of graphics formats from which Igor can import pictures:
| Format | Notes |
|---|---|
| PDF (Portable Document Format) | Supported in Igor Pro 9.00 and later. |
| See Importing PDF Pictures. | |
| EMF (Enhanced Metafile) | Supported in Windows native graphics only. |
| See Graphics Technology on Windows for information about different types of EMF pictures. | |
| BMP (Windows bitmap) | BMP is sometimes called DIB (Device Independent Bitmap). |
| PNG (Portable Network Graphics) | Lossless cross-platform bitmap format. |
| JPEG | Lossy cross-platform bitmap format. |
| TIFF (Tagged Image File Format) | Lossless cross-platform bitmap format. |
| EPS (Encapsulated PostScript) | High resolution vector format. Requires PostScript printer. In Qt graphics mode, a screen preview is displayed on screen. |
| SVG (Scalable Vector Graphics) | Cross-platform vector and bitmap format. |
| Always rendered using Qt graphics. In other graphics technology modes, it is drawn into a high-resolution bitmap before which is then drawn on the screen, exported, or printed. |
Formats that are not supported on the current platform are drawn as gray boxes.
See Also: Picture Compatibility for a discussion of Macintosh graphics on Windows and vice-versa.
Importing PDF Pictures
PDF (Portable Document Format) is Adobe's platform-independent vector graphics format. However, not all programs can import PDF.
Igor supports importing PDF graphics in Igor Pro 9 or later. PDF pictures are drawn using bitmaps.
The Picture Gallery
When you create a named picture, using one of the techniques listed above, Igor stores it in the current experiment's picture gallery. When you save the experiment, the picture gallery is stored in the experiment file. You can inspect the collection using the Pictures dialog (Misc menu).
Igor gives names to pictures so they can be referenced from an Igor procedure. For example, if you paste a picture into a layout, Igor assigns it a name of the form PICT_0 and stores it in the picture gallery. If you then close the layout and ask Igor to create a recreation macro, the macro will reference the picture by name.
You can rename a named picture using the Pictures dialog in the Misc menu, the Rename Objects dialog in the Misc menu, the Rename dialog in the Data menu, or the RenamePICT command line operation. You can kill a named picture using the Pictures dialog or the KillPICTs command line operation.
Notebook Pictures
When you paste a picture into a formatted notebook, you create a notebook picture that is available in that notebook only. These work just like pictures in a word processor document. You can copy and paste them. These pictures will not appear in the Pictures or Rename Objects dialogs.
See Also
Picture Compatibility for a discussion of Macintosh graphics on Windows and vice-versa.