Annotations
Annotations are custom objects that add information to a graph, page layout or Gizmo plot.
Most annotations contain text that you might use to describe the contents of a graph, point out a feature of a wave, identify the axis that applies to a wave, or create a legend. An annotation can also contain color scales showing the data range associated with colors in contour and image plots.
There are four types of annotation: textboxes, legends, color scales, and tags.
A textbox contains one or more lines of text which optionally may be surrounded by a frame, rotated, colorized and aligned.
A legend is similar to a textbox except that it contains trace symbols for one or more waves in a graph. Legends are automatically updated when waves are added to or removed from the graph, or when a wave's appearance is modified.
A tag is also similar to a textbox except that it is attached to a point of a trace or image and can contain dynamically updated text describing that point. Tags can be added to graphs, but not to page layouts or Gizmo plots. In contour plots, Igor automatically generates tags to label the contour lines.
A color scale contains a color bar with an axis that spans the range of colors associated with the data. Color scales are automatically updated when the associated data changes. A color scale can also be completely disassociated from any data by directly specifying a named color table and an explicit numeric range for the axis.
Annotations Quick Start
| To Do This | Do This |
|---|---|
| To add an annotation to a graph | Choose Add Annotation from the Graph menu. |
| To add an annotation to a page layout | Choose Add Annotation from the Layout menu or click with the annotation ("A") tool. |
| To add an annotation to a Gizmo plot | Choose Add Annotation from the Gizmo menu. |
| To modify an annotation in a graph | Double-click the annotation. This invokes the |
| or Gizmo plot | Modify Annotation dialog. |
| To modify an annotation in a page layout | Single-click the annotation with the annotation tool. This invokes the Modify Annotation dialog. |
| To change the annotation type | Use the Annotation pop-up menu in the Modify Annotation dialog, or use the proper Tag, TextBox, ColorScale, or Legend operation. |
| To move an existing annotation | Click in the annotation and drag it to the new position. If the annotation is frozen, this won't work -- double-click it and make it moveable in the Annotation Position tab. |
| To change a tag's attachment point, press Alt and drag the tag text to the new attachment point on the wave. This works whether or not the tag is frozen. | |
| To duplicate an existing annotation | Double-click the annotation, then click the Duplicate Textbox button in upper-right corner of the Modify Annotation dialog. If the annotation is a tag, the button is titled Duplicate Tag, etc. |
| To delete an annotation | Double-click the annotation, then click the Delete button in the Modify Annotation dialog. A tag can be deleted by dragging its attachment point off the graph. |
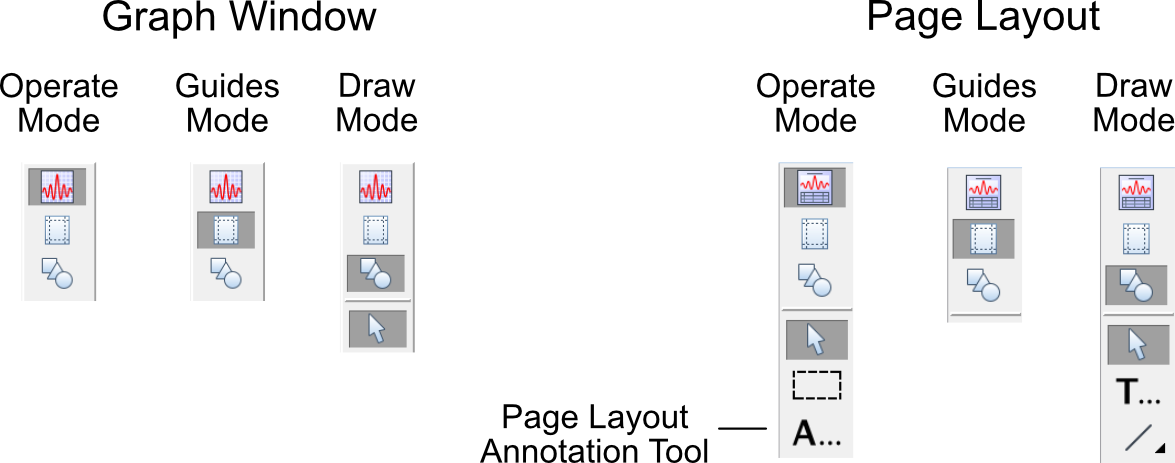
When manipulating annotations with the mouse, be sure that the graph or page layout are in the "operate" mode, not the "guides" or "drawing" mode. The tool palette indicates which mode the window is in:
The Annotation Dialog
You can use the annotation dialog to create new annotations or modify existing annotations. The annotation dialog seems complex but comprises only a few major functions:
-
A pop-up menu to choose the annotation type.
-
A Name setting.
-
Tabs that group related Annotations settings.
-
A Preview box to show what the annotation will look like or to display commands.
-
The normal Igor dialog buttons.
Modifying Annotations
If an annotation is already in a graph or Gizmo plot, you can modify it by double-clicking it while in the "operate" mode. This invokes the Modify Annotation dialog.
In a page layout, to modify an annotation, you must first select the Annotation ("A") tool in layout mode. Then single-click the annotation to invoke the Modify Annotation dialog.
Annotation Text Content
You enter text into the Annotation text entry area in the Text tab.
The annotation text may contain both plain text and "escape code" text which produces special effects such as superscript, font, font size and style, alignment, text color and so on. The text can contain multiple lines. At any point when entering plain text, you can choose a special effect from a pop-up menu within the Insert group, and Igor will insert the corresonding escape code. Igor wizards can type them in directly.
As you type annotation text, the Preview box shows what the resulting annotation will look like. You cannot enter text in the Preview box.
Annotation Text Escape Codes
An escape code consists of a backslash character followed by one or more characters. It represents the special effect you selected. The effects of the escape code persist until overridden by a following escape code. The escape codes are cryptic but you can see their effects in the Preview box.
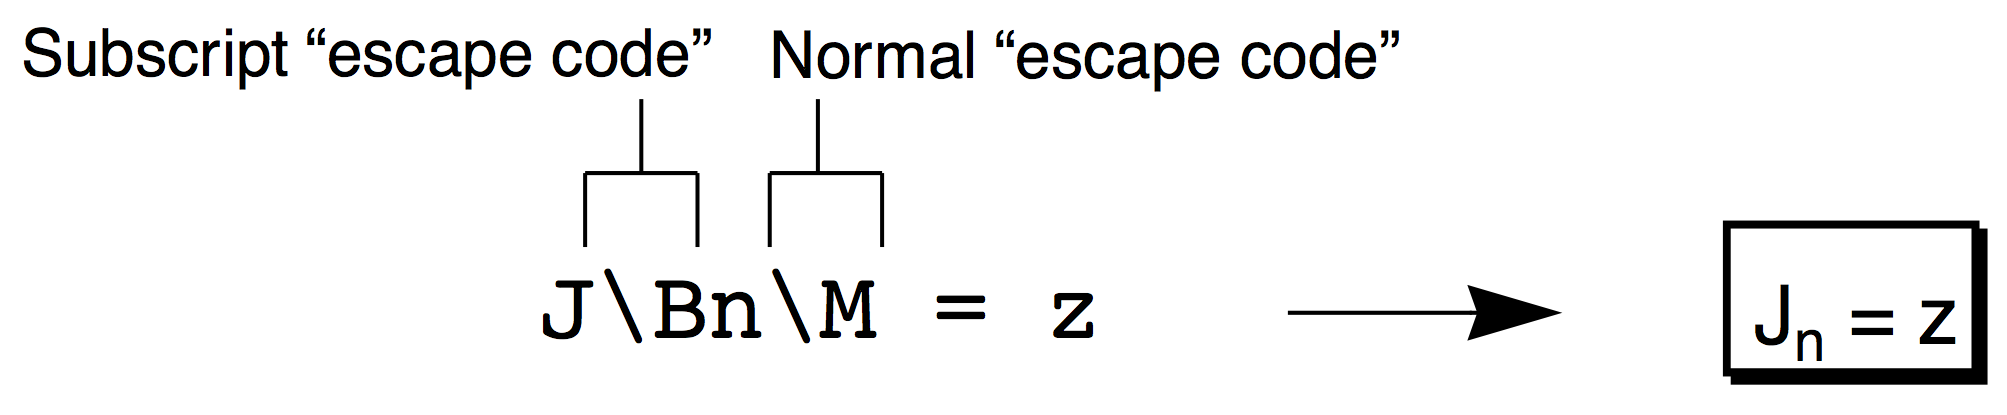
In the example below, the subscript escape code "\B" begins a subscript and is not displayed in the annotation; the "n" that follows is plain text displayed as a subscript. The normal escape code "\M" overrides the subscript mode so that the plain text "= z" that follows has the original size and Y position (vertical offset) used for the "J".
The section Annotation Escape Codes provides detailed documentation for the escape codes.
Font Escape Codes
Choosing an item from the Font pop-up menu inserts a code that changes the font for subsequent characters in the annotation. The checked font is the font currently in effect at the current insertion point in the annotation text entry area.
If you don't choose a font, Igor uses the default font or the graph font for annotations in graphs. You can set the default font using the Default Font item in the Misc menu, and the graph font using the Modify Graph item in the Graph menu. The Font pop-up menu also has a "Recall font" item. This item is used in elaborate annotations and is described under Text Info Variable Escape Codes.
Font Size Escape Codes
Choosing an item from the Font Size pop-up menu inserts a code that changes the font size for subsequent characters in the annotation. The checked font size is the size currently in effect at the current insertion point in the annotation text entry area.
To insert a size not shown, choose any shown size, and edit the escape code to contain the desired font size. Annotation font sizes may be 03 to 99 points. Two digits are required after the "\Z" escape code.
If you specify no font size escape code for annotations in graphs, Igor chooses a font size appropriate to the size of the graph unless you've specified a graph font size in the Modify Graph dialog. The default font size for annotations in page layouts is 10 points. The Font Size pop-up menu contains a "Recall size" item. This item is used in elaborate annotations and is described under Text Info Variable Escape Codes.
Relative Font Size Escape Codes
Choosing an item from the Rel. Font Size pop-up menu inserts a code that changes the relative font size for subsequent characters in the annotation. Use values larger than 100 to increase the font size, and values smaller than 100 to decrease the font size.
To insert a size not shown, choose any shown relative size, and edit the escape code to contain the desired relative font size. Annotation relative font sizes may be 001 to 999 (1% to 999%). Three digits are required after the "\Zr" escape code.
Don't use, say, 50% followed by 200% and expect to get exactly the original font size back; rounding inaccuracies will prevent success (because font sizes are handled as only integers). For example, if you start with 15 point text and use \Zr050 (50%) the result is 7 point text. 200% of 7 points is only 14 point text. Instead, use the Normal "\M" escape code, or an absolute font size or a recalled font size, to return to a known font size.
Special Escape Codes
Choosing an item from the Special pop-up menu inserts an escape code that makes subsequent characters superscript, subscript or normal, affects the style, position or color of subsequent text, or inserts the symbol with which a wave is plotted in a graph.
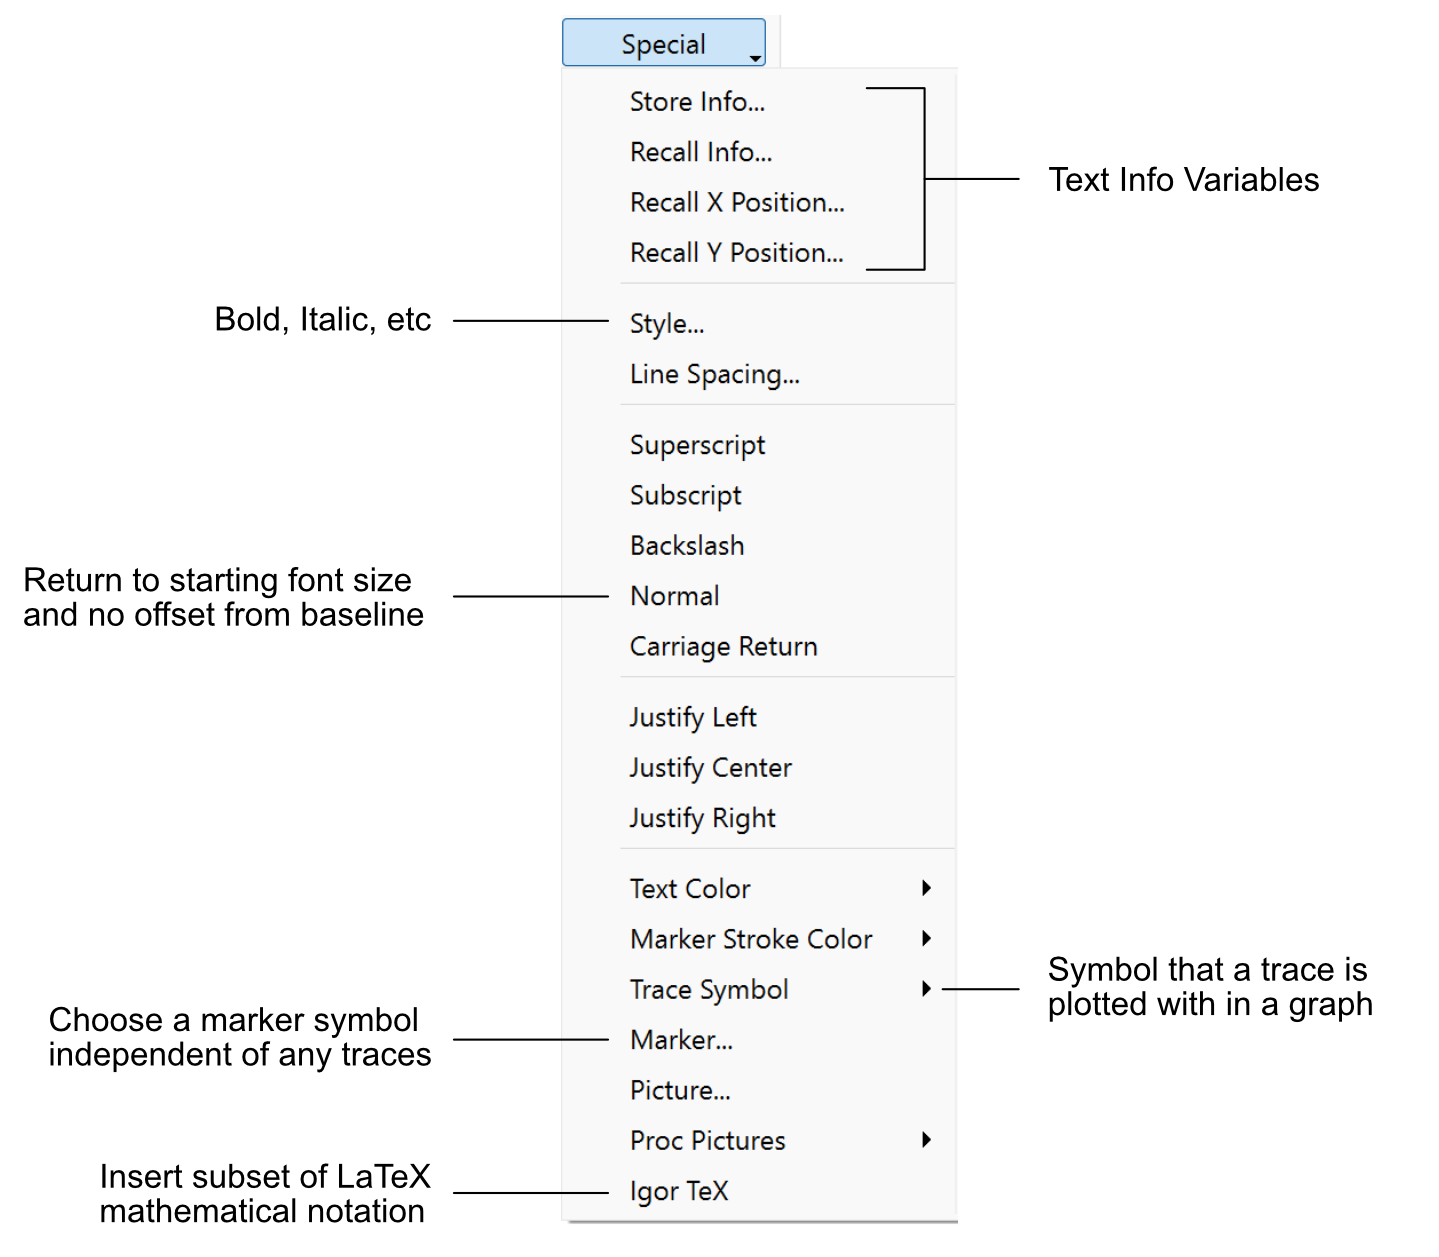
The first four items, Store Info, Recall Info, Recall X Position, and Recall Y Position are used to make elaborate annotations and are described under Text Info Variable Escape Codes.
The Style item invokes a subdialog that you use to change the style (bold, italic, etc.) for the annotation at the current insertion point in the annotation text entry area. This subdialog has a Recall Style checkbox that is used in elaborate annotations with text info variables.
The Superscript and Subscript items insert an escape code that makes subsequent characters superscript or subscript. Use the Normal item to return the text to the original text size and Y position.
The Backslash item inserts a code to insert a backslash that prints, rather than one which introduces an escape code. Igor does this by inserting two backslashes, which is an escape code that represents a backslash.
The Normal item inserts a code to return to the original font size and baseline. More precisely, Normal sets the font size and baseline to the values stored in text info variable 0 (see Text Info Variable Escape Codes). The font and style are not affected.
The Justify items insert codes to align the current and following lines.
The Text Color item inserts a code to color the following text. The initial text color and the annotation background color are set in the Frame Tab.
The Trace Symbol item inserts a code that prints the symbol (line, marker, etc.) used to display the trace in the graph. This code is inserted automatically by Igor in a legend. You can use this menu item to manually insert a symbol into a tag, textbox, or color scale. For graph annotations, the submenu lists all the trace name instances in the top graph. For layout annotations, all the trace name instances in all graphs in the layout are listed.
The Marker item inserts a code to draw a marker symbol. These symbols are independent of any traces in the graph.
The Igor TeX item inserts a starting template \$WMTEX$ xxx \$/WMTEX$ so you can replace the xxx with a subset of LaTeX mathematical expressions. See Igor TeX for details.
Dynamic Escape Codes for Tags
The Dynamic pop-up menu inserts escape codes that apply only to tags. These codes tell Igor to insert information about the wave or point in the wave to which the tag is attached. Igor automatically updates this information whenever the wave or the attachment point changes.
| Dynamic Item | Effect |
|---|---|
| Wave name | Displays the name of the wave to which the tag is attached. |
| Trace name and instance | Same as wave name but appends an instance number (e.g., #1) if there is more than one trace in the graph associated with a given wave name. |
| Attach point number | Displays the number of the tag attachment point. |
| Attach point X value | Displays the X value of the tag attachment point. |
| Attach point Y value | Displays the Y value of the tag attachment point. |
| Attach point Z value | Displays the Z value of the tag attachment point. Available only for contour traces, waterfall plots, or image plots. |
| Attach X offset value | Displays the trace's X offset. |
| Attach Y offset value | Displays the trace's Y offset. |
See also TagVal and TagWaveRef Functions. These functions provide the same information as the Dynamic pop-up menu items but with greater flexibility.
Other Dynamic Escape Codes
You can enter the dynamic text escape sequence which inserts dynamically evaluated text into any kind of annotation using the escape code sequence:
\{dynamicText }
where dynamicText may contain numeric and string expressions. This technique is explained under Dynamic Text Escape Codes.
TagVal and TagWaveRef Functions
If the annotation is a tag, you can use the functions TagVal and TagWaveRef to display information about the data point to which the tag is attached. For example, the following displays the Y value of the tag's data point:
\{"%g", TagVal(2)}
This is identical in effect to the "\0Y" escape code which you can insert by choosing the "Attach point Y value" item from the Dynamic pop-up menu. The benefit of using the TagVal function is that you can use a formatting technique other than %g. For example:
\{"%5.2f",TagVal(2)}
TagVal is capable of returning all of the information that you can access via the Dynamic menu escape codes. Use it when you want to control the numeric format of the text.
The TagWaveRef function returns a reference to the wave to which the tag is attached. You can use this reference just as you would use the name of the wave itself. For example, given a graph displaying a wave named wave0, the following tag text displays the average value of the wave:
\{"%g",mean(wave0)}
This is fine, but if you move the tag to another wave it will still show the average value of wave0. Using TagWaveRef, you can make this show the average value of whichever wave is tagged:
\{"%g",mean(TagWaveRef())}
The TagVal and TagWaveRef functions work only while Igor is in the process of evaluating the annotation text, so you should use them only in annotation dynamic text or in a function called from annotation dynamic text.
Annotation Tabs
The Text Tab's Annotation text area actually has two functions which are controlled by the pop-up menu at its top-left corner. If you choose Set Tabs from this pop-up menu, Igor shows the tab stops for the annotation.
By default, an annotation has 10 tab stops spaced 1/2 inch apart. You can change the tab stops by dragging them along the ruler. You can remove a tab stop by dragging it down off the ruler. You can add a tab by dragging it from the tab storage area at the left onto the ruler.
Igor supports a maximum of 10 tab stops per annotation and they are always left-aligned tabs. There is only one set of tab stops per annotation and they affect the entire annotation.
General Annotation Properties
Most annotation properties are common to all kinds of annotations.
Annotation Name
You can assign a name to the annotation with the Name item. In the Modify Annotation dialog, this is the Rename item. The name is used to identify the annotation in a Tag, TextBox, ColorScale, or Legend operation. Annotation names must be unique in a given window. See Programming with Annotations for more information.
Annotation Frame
In the Frame Tab, the Frame and Border pop-up menus allow you to frame the annotation with a box or shadow box, to underline the textbox, or to have no frame at all. The line size of the frames and the shadow are set by the Thickness and Shadow values.
By default, framed annotations also have a 1-point "halo" that surrounds them to separate them from their surroundings. The halo takes on the color of the annotation's background color. You can change the width of this halo to a value between 0 and 10 points by setting the desired thickness in the Halo box in the Frame tab. A fractional value such as 0.5 is permitted.
Specifying a negative value for Halo allows the halo thickness to be overridden by the global variable V_TBBufZone in the root data folder. If the variable doesn't exist, the absolute value of the entered value is used. The default halo value is -1. You can override the default halo by setting the V_TBBufZone global in a IgorStartOrNewHook hook function. See the example in User-Defined Hook Functions.
Annotation Color
The Frame tab contains most of the annotation's color settings.
Use the Foreground Color pop-up menu to set the initial text color. You can change the color of the text from the initial foreground color by inserting a color escape code using the Special pop-up menu in the Text tab.
Use the Background pop-up menu to set the background mode and color:
| Background Color Mode | Effect |
|---|---|
| Opaque | The annotation background covers objects behind. You choose the background color from a pop-up menu. |
| Transparent | Objects behind the annotation show through. |
| Graph color | The background is opaque and is the same color as the graph background color. This is not available for annotations added to page layout windows. |
| Window color | The background is opaque and is the same color as the window background color. |
Annotation Positioning
You can rotate the annotation into the four principal orientations with the in the Position tab's Rotation pop-up menu. You can also enter an arbitrary rotation angle in integral degrees. Tags attached to contour traces and color scales have specialized rotation settings; see Modifying Contour Labels and ColorScale Size and Orientation.
You can position an annotation anywhere in a window by dragging it and in many cases this is all you need to know. However, if you attend to a few extra details you can make the annotation go to the correct position even if you resize the window or print the window at a different size.
This is particularly important when a graph is placed into a page layout window, where the size of the placed graph usually differs from the size of the graph window.
Annotations are positioned using X and Y offsets from "anchor points". The meaning of these offsets and anchors depends on the type of annotation and whether the window is a graph, layout or Gizmo plot. Tags, for instance, are positioned with offsets expressed as a percentage of the horizontal and vertical sizes of the graph. See Tag Positioning.
Textbox, Legend, and Color Scale Positioning in a Graph
A textbox, legend, and color scale are positioned identically, so this description will use "textbox" to refer to all of them. A textbox in a graph can be "interior" or "exterior" to the graph's plot area. You choose this positioning option with the Exterior checkbox:
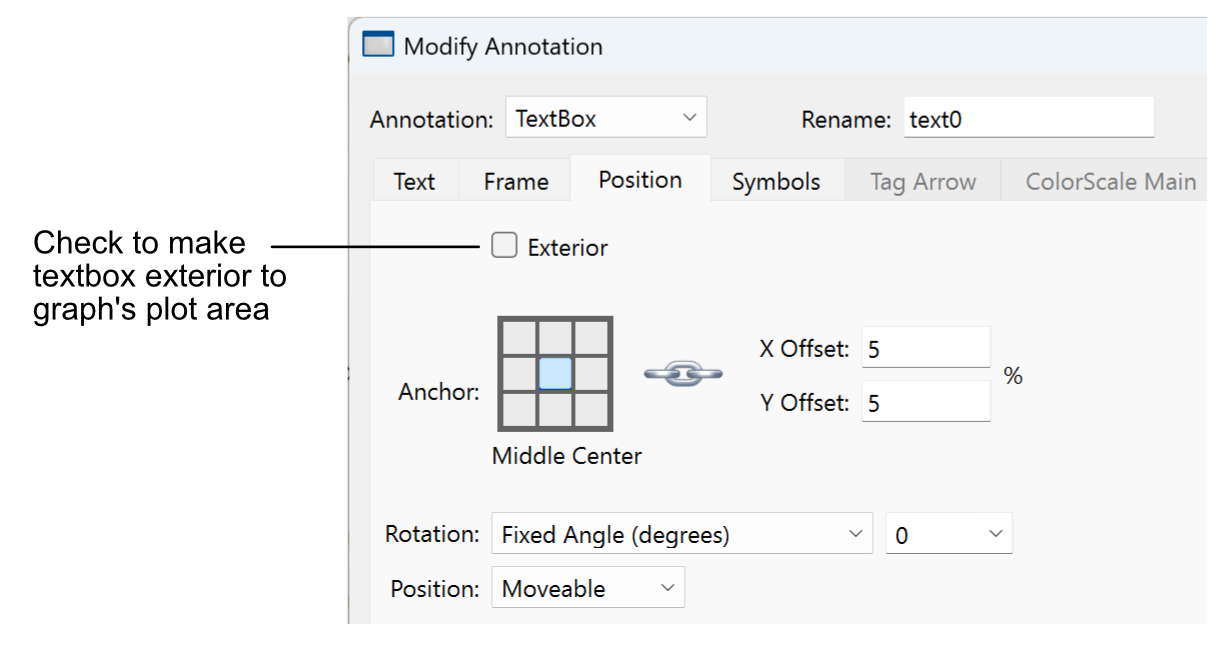
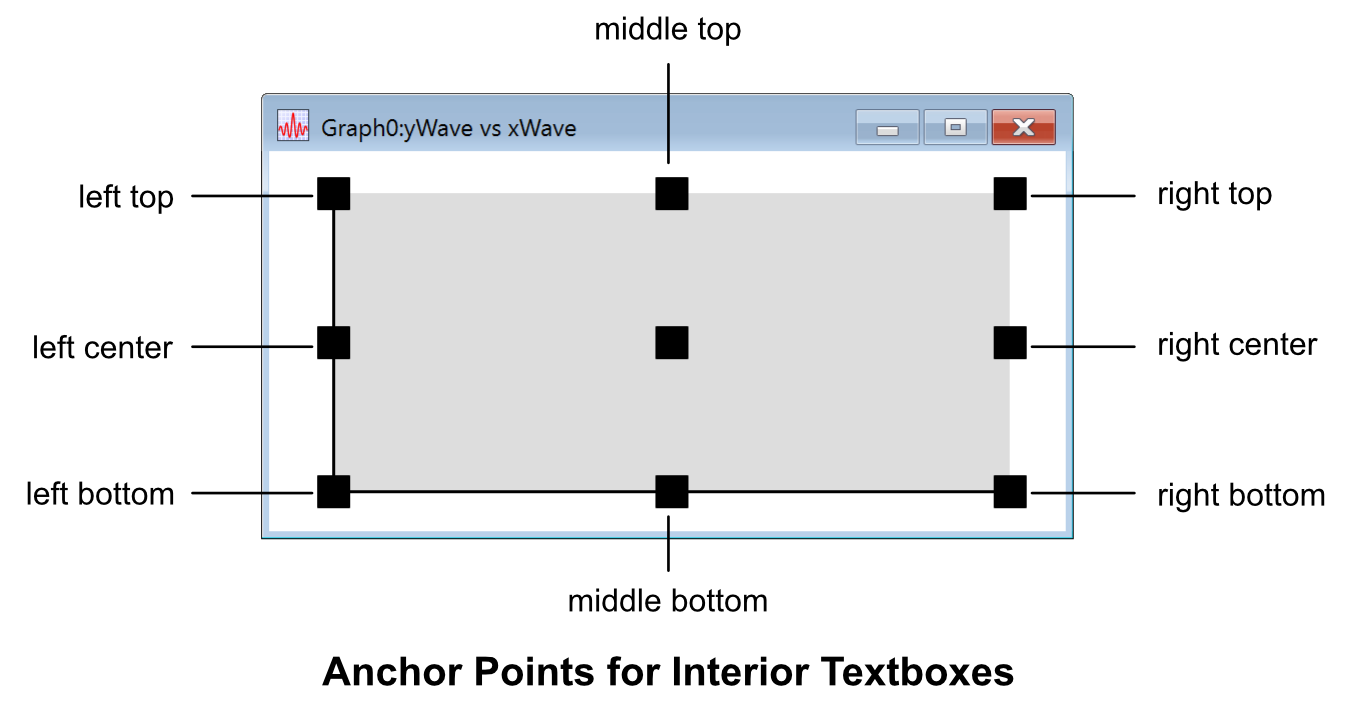
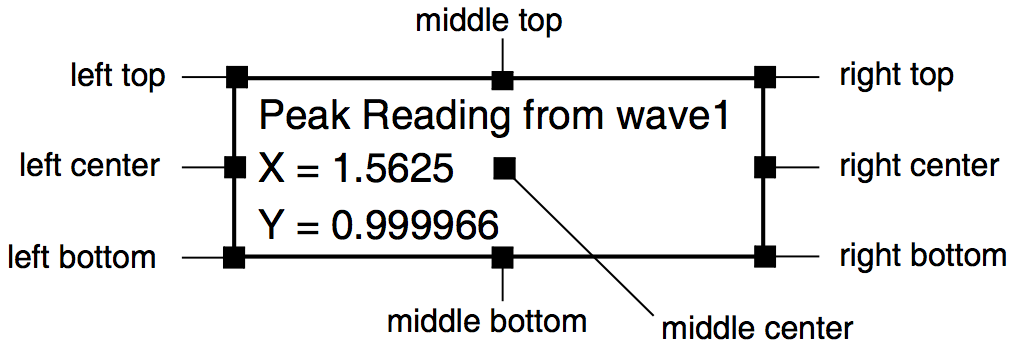
The Anchor widget specifies the precise location of the reference point on the plot area or graph window edges. It also specifies the location on the textbox which Igor considers to be the "position" of the textbox.
An interior textbox is positioned relative to a reference point on the edge of a graph's plot area. (The plot area is the central rectangle in a graph window where traces are plotted. The standard left, right, bottom, and top axes surround this rectangle.)
An exterior textbox is positioned relative to a reference point on the edge of the window and the textbox is normally outside the plot area.
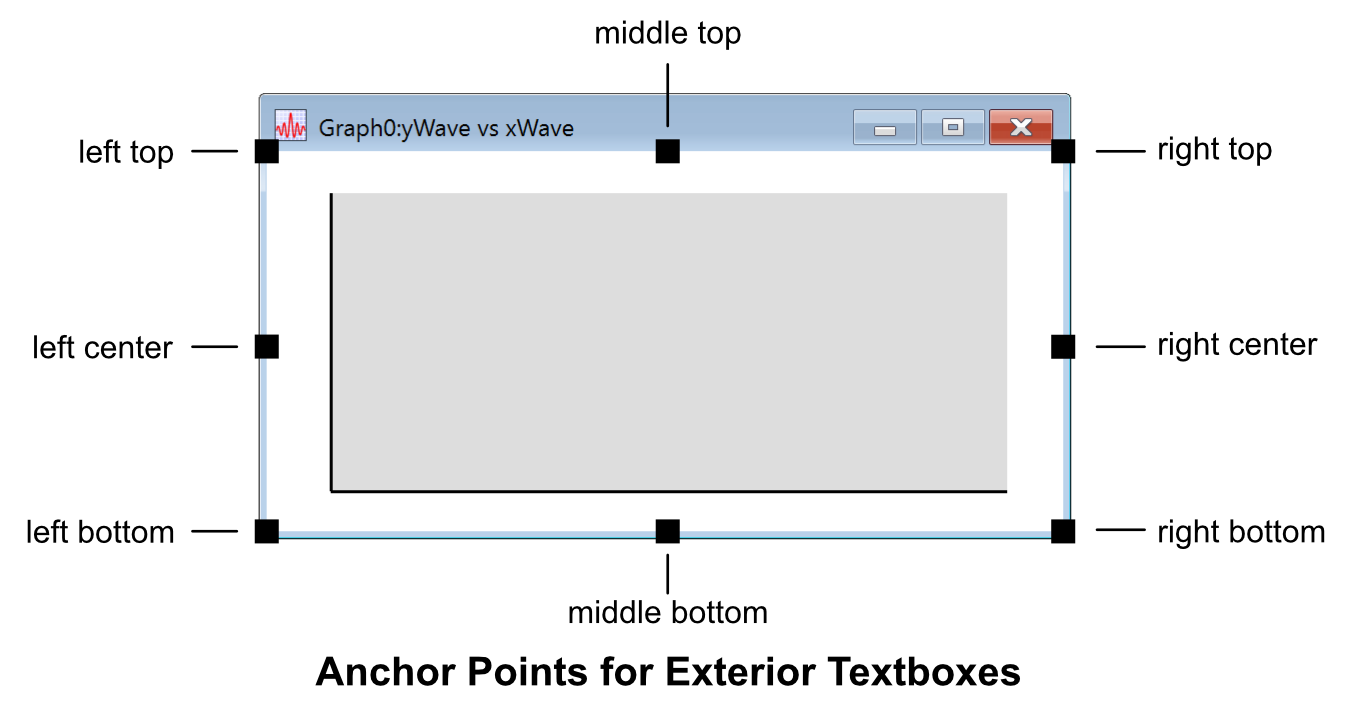
The purpose of the exterior textbox is to allow you to place a textbox away from the plot area of the graph. For example, you may want it to be above the top axis of a graph or to the right of the right axis. Igor tries to keep exterior textboxes away from the graph by pushing the graph away from the textbox.
The direction in which it pushes the graph is determined by the textbox's anchor. If, for example, the textbox is anchored to the top then Igor pushes the graph down, away from the textbox. If the anchor is middle-center, Igor does not attempt to push the graph away from the textbox. So, an exterior textbox anchored to the middle-center behaves like an interior textbox.
If you specify a margin, using the Modify Graph dialog, this overrides the effect of the exterior textbox, and the exterior textbox will not push the graph.
The XY Offset in the Position Tab gives the horizontal and vertical offset from the anchor to the textbox as a percentage of the horizontal and vertical sizes of the graph's plot area for interior textboxes or the window sizes for exterior textboxes.
The Position pop-up menu allows you to set the position to moveable or frozen. "Frozen" means that the position of the textbox cannot be moved with the mouse. This is useful if you are using the textbox to label an axis tick mark and don't want to accidentally move it.
Annotation Positioning in a Page Layout
Annotations in a page layout window are positioned relative to an anchor point on the edge of the printable part of the page. The distance from the anchor point to the textbox is determined by the X and Y offsets which are in percent of the printable page. Annotations in a page layout cannot be "frozen" as they can in a graph.
Legends
A legend is very similar to a textbox. It shows the symbol for some or all of the traces in a graph or page layout. To make a legend, choose Add Annotation from the Graph or Layout menu. This invokes the Add Annotation dialog:
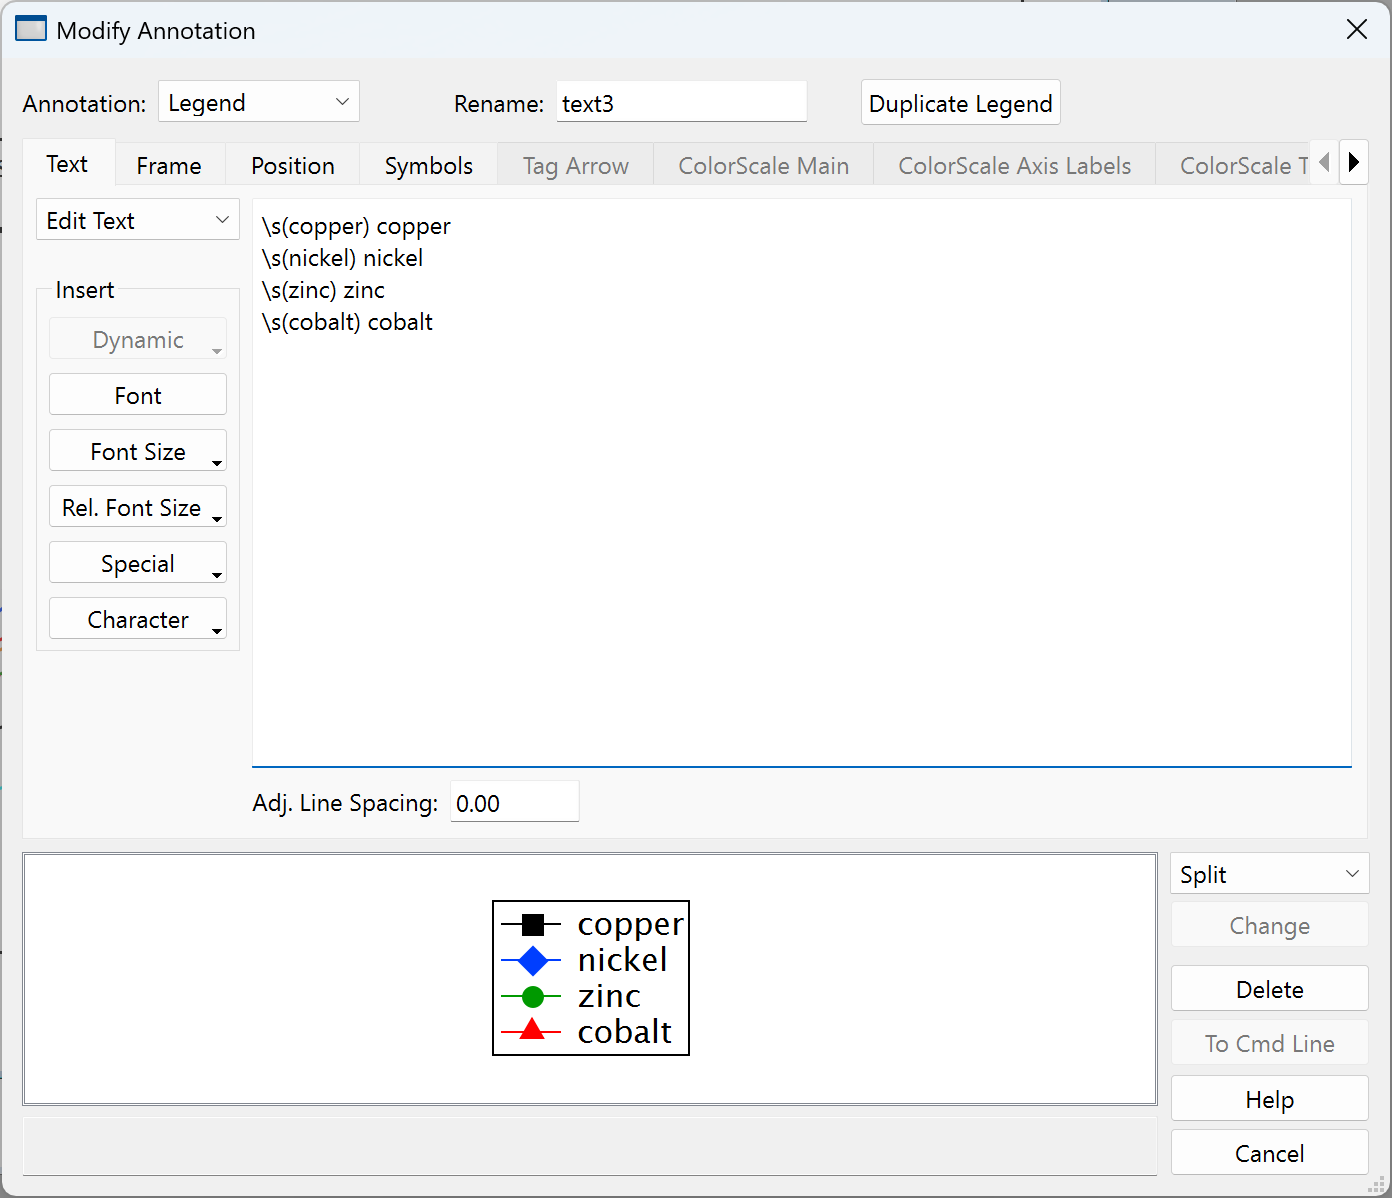
The pop-up menu at the top left of the dialog sets the type of the annotation: TextBox, Tag, Legend or ColorScale. If you choose Legend when there is no text in the text entry area, Igor automatically generates the text needed for a "standard legend". To keep the standard legend, just click Do It. However, you can also modify the legend text as you can for any type of annotation.
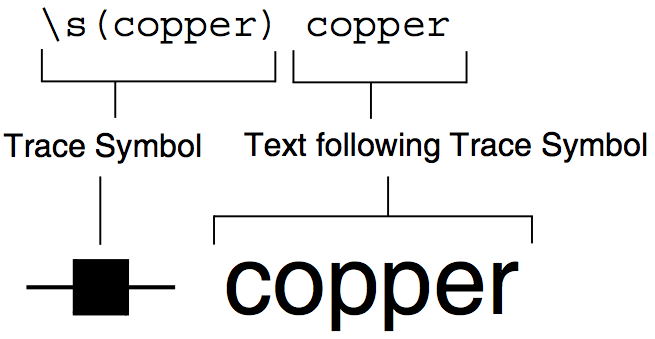
Legend Text
The legend text consists of an escape sequence to specify the trace whose symbol you want in the legend plus plain text. In this example dialog above, \s(copper) is the escape sequence that inserts the trace symbol (a line and a filled square marker) for the trace whose name is copper. This escape sequence is followed by a space and the name of the wave. The part after the escape sequences is plain text that you can edit as needed.
Instead of specifying the name of the trace for a legend symbol, you can specify the trace number. For example, "\s(#0)" displays the legend for trace number 0.
There are only two differences between a legend and a textbox. First, text for a legend is automatically generated when you choose Legend from the pop-up menu while there is no text in the text entry area. Second, if you append or remove a wave from the graph or rename a wave, the legend is automatically updated by adding or removing trace symbols. Neither of these two actions occur for a textbox, tag or color scale.
See Trace Names for details on trace names.
Symbol Conditions at a Point
You can create a legend symbol that shows the conditions at a specific point of a trace by appending the point number in brackets to the trace name. For example \s(copper[3]). This feature is useful when a trace uses f(z) mode or when a single point on a trace has been customized
Freezing the Legend Text
Occasionally you may not want the legend to update automatically when you append waves to the graph. You can freeze the legend text by converting the annotation to a textbox. To create a non-updating legend, invoke the Add Annotation dialog. Choose Legend from the pop-up menu to get Igor to create the legend text, then choose TextBox from the pop-up menu. Now you have converted the legend to a textbox so it will not be automatically updated.
Marker Size
A trace symbol includes a marker if the trace is drawn with one.
Normally the size of the marker drawn in the annotation is based on the font size in effect when the marker is drawn. When you set the font size before the trace symbol escape code, both the marker and following text are adjusted in proportion. You can also change the font size after the trace symbol, which sets the size of the following text only, without affecting the marker size.
The second method for setting the size of a marker is to choose "Same as on Graph" from the Marker Size pop-up menu in the Symbols Tab. Then the marker size matches the size of the corresponding marker in the graph, regardless of the size of the annotation's text font.
Trace Symbol Centering
Some trace symbols are vertically centered relative to either the text that precedes or the text that follows the trace symbol escape code, and other symbols are drawn with their bottom at the baseline.
Among the trace styles whose symbols are centered are lines between points, dots, markers, lines and markers, and cityscape. Among the trace styles whose symbols are drawn from the baseline are lines from zero, histogram bars, fill to zero, and sticks and markers.
Trace Symbol Width
The trace symbol width is the width in which all trace symbols in a given legend are drawn. This width is controlled by the font size of the text preceding the trace symbol, or it is set explicitly to a given number of points using the Symbol Width value in the Symbols Tab.
You can widen or narrow the overall symbol size by entering a nonzero width value for Symbol Width. If you use large markers with small text, you may find it necessary to reduce the trace symbol width using this setting. For some line styles that have long dash/gap patterns, you will want to enter an explicit value large enough to show the pattern.
Symbol With Color as f(z)
If you create a graph that uses color as f(z) you may want to create a legend. See Color as f(z) Legend Example for a discussion of how to do this.
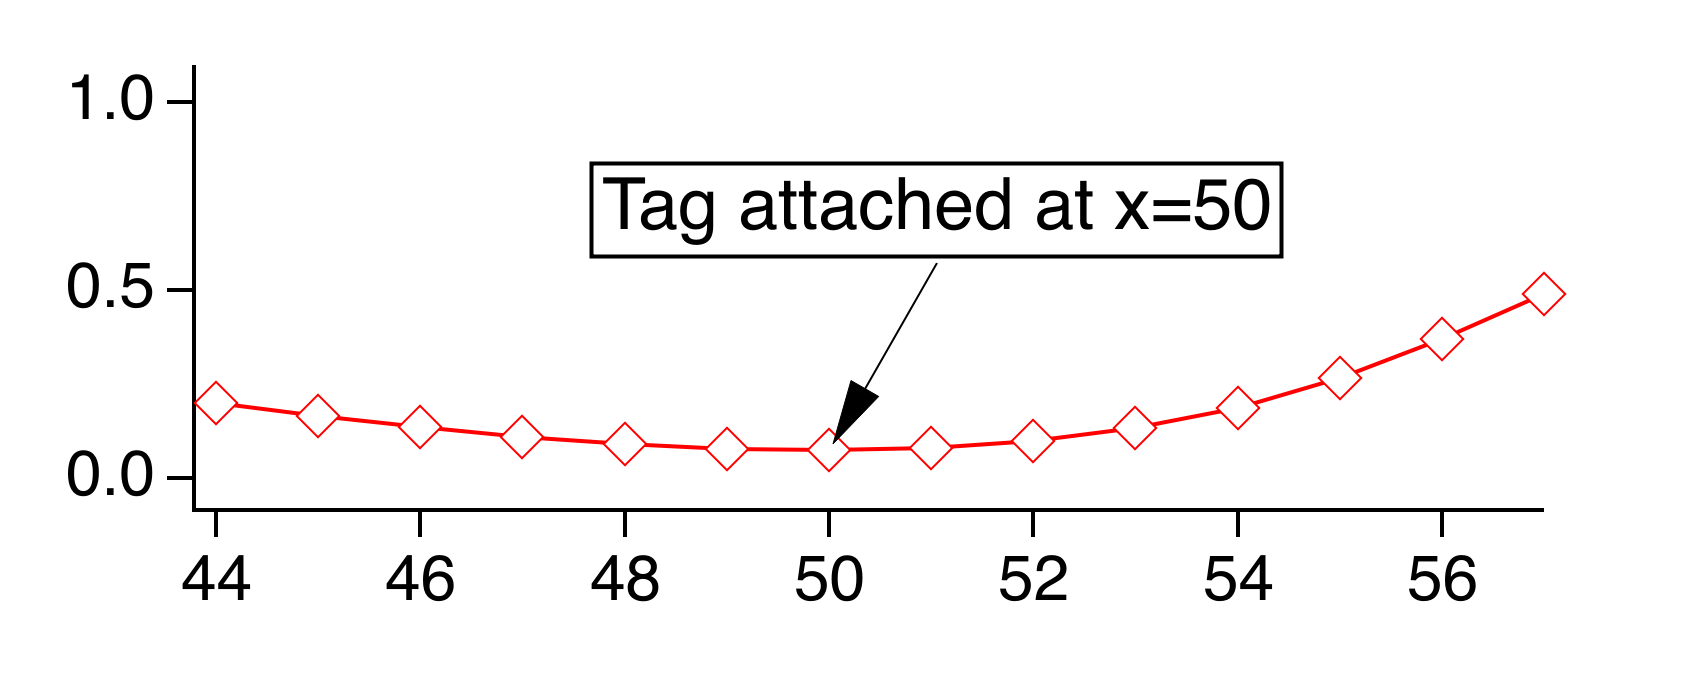
Tags
A tag is like a textbox but with several added capabilities. A tag is attached to a particular point on a particular trace, image, or waterfall plot in a graph:
Tags cannot be added to page layouts or Gizmo plots. However, a graph containing a tag can be added to a page layout.
Igor automatically generates tags to label contour plots.
Tag Text
Text in a tag can contain anything a textbox or legend can handle, and more.
The Dynamic pop-up menu of the Text Tab inserts escape codes that apply only to tags. These codes tell Igor to insert information about the wave the tag is attached to, or about the point in the wave to which the tag is attached. This information is "dynamically" updated whenever the wave or the attachment point changes. See Dynamic Escape Codes for Tags.
The TagVal and TagWaveRef functions are also useful when creating a tag with dynamic text. See TagVal and TagWaveRef Functions.
Tag Wave and Attachment Point
You specify which wave the tag is attached to in the Position Tab, by choosing a wave from the "Tag on" pop-up menu.
You specify which point the tag is attached to by entering the point number in the "At p=" entry or an X value in the "At x=" entry. The X value is in terms of the X scaling of the wave to which you are attaching the tag. This is not necessarily the same as the X axis position of the point if the wave is displayed in XY mode. It is the X value of the Y wave point to which the tag is attached. If this distinction mystifies you, see The Waveform Model of Data.
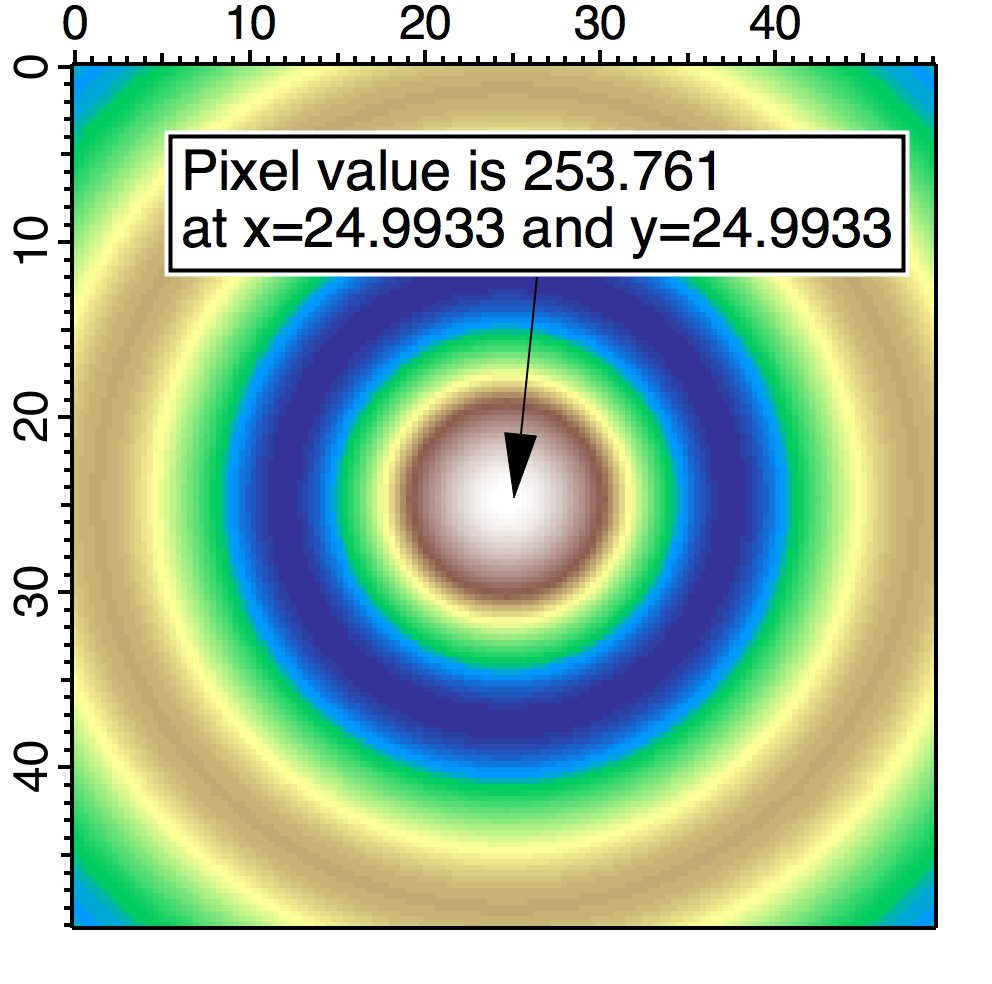
The attachment point of a tag in a (2D) image or waterfall plot is treated a bit differently than for 1D waves. In images it is the sequential point number linearly indexed into the matrix array. The dialog converts this point number, entered as the "At p=" setting, into the X and Y values, and vice versa.
Since it is the point number that determines the actual attachment point, because of rounding, the tag is not necessarily attached exactly at the entered "At x=" and "At y=" values.
In the following dialog the X and Y values were entered as 0, but the nearest point (434) results in an actual attachment point of (-0.0689655,-0.0689655):
As described in the next section, you can position the tag manually by dragging.
Changing a Tag's Attachment Point
Once a tag is on a graph you can attach it to a different point by pressing Alt, clicking in the tag, and dragging the special tag cursor  to the new attachment point on the trace. You must drag the tag cursor to the point on the trace to which you want to attach the tag, not to the position on the screen where you want the tag text to appear. The dot in the center of the tag cursor shows where the tag will be attached.
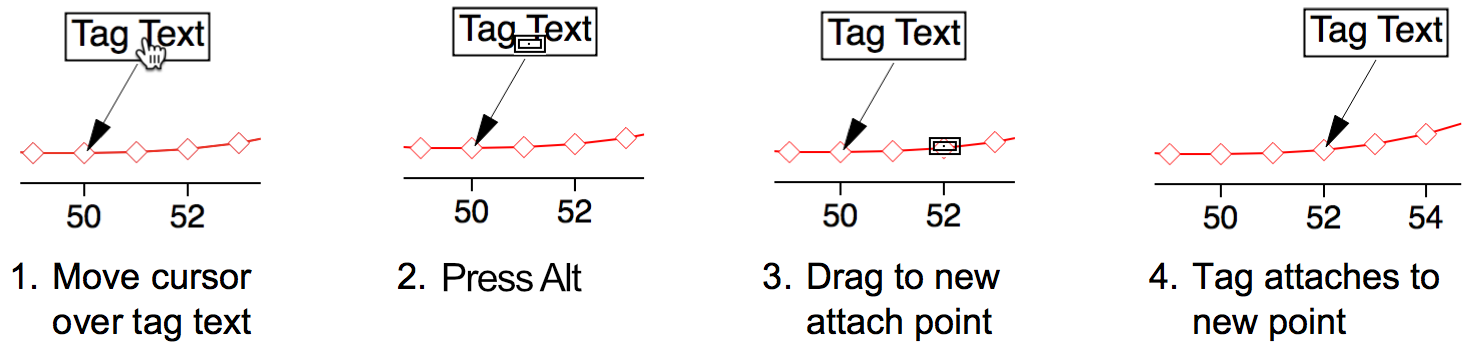
If you drag the tag cursor off the graph, the tag is deleted from the graph.
Tag Arrows
You can indicate a tag’s attachment point with an arrow or line drawn from the tag's anchor point using the "Connect Tag to Wave with" pop-up menu in the Tag Arrows tab:
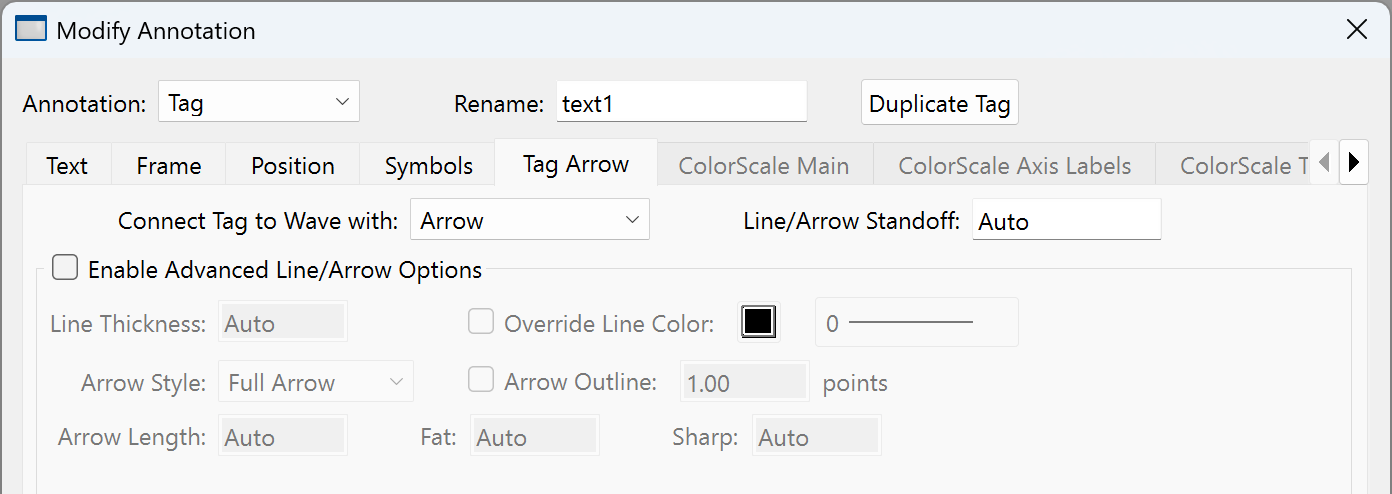
You can adjust how close the arrow or line comes to the data point by setting the Line/Arrow Standoff distance in units of points.
The Advanced Line/Arrow options give you added control of the line and arrow characteristics.
A Line Thickness value of 0 corresponds to the default line thickness of 0.5 points. Otherwise, enter a value up to 10.0 points. To make the line disappear, select No Line from the “Connect Tag to Wave with:” popup menu.
The line color is normally set by the annotation frame color (in the Frame tab). You can override this by checking the Override Line Color checkbox and choosing a color from the popup menu.
Change the attachment line's style from the default solid line using the line style popup menu.
If "Connect Tag to Wave with:" popup is set to Arrow, you can control the appearance of the arrowhead using the remaining controls. Options include full or half arrowhead, filled or outlined arrowhead, arrow length, fatness and sharpness.
The Arrow Length setting is in units of points with 0 or Auto giving the default length.
The Sharp setting is a small value between -1.0 and 1.0. 0 or Auto gives the default sharpness.
The Fat setting specifies the width-to-length ratio. 0 or Auto gives the default ratio of 0.5. Larger numbers result in fatter arrows. If the number is small (say, 0.1), the arrow may seem to disappear unless the arrow length is made longer. Printed arrows can appear narrower than screen-displayed arrows.
Tag Line and Arrow Standoff
You can tell Igor how close to bring the line or arrow to that trace with the Line/Arrow Standoff setting. You can enter an explicit distance in points. If you enter Auto or 0, Igor varies the distance according to the output device resolution and graph size. Use a value of 1 to bring the line as near to the trace as possible. When the wave is graphed with markers, you might prefer to set the standoff to a value larger than the marker size so that the line or arrow does not intersect the marker.
Tag Anchor Point
A tag has an anchor point that is on the tag itself. If there is an arrow or line, it is drawn from the anchor point on the tag to the attachment point on the trace. The anchor setting also determines the precise spot on the tag which represents the position of the tag.
The line is always drawn behind the tag so that if the anchor point is middle center the line doesn't interfere with the text.
Tag Positioning
The position of a tag is determined by the position of the point to which it is attached and by the XY Offset settings in the Position tab. The XY offset gives the horizontal and vertical distance from the attachment point to the tag's anchor in percentage of the horizontal and vertical sizes of the graph's plot area.
Once a tag is on a graph you can change its XY offset and therefore its position by merely dragging it. You can prevent the tag from being dragged by choosing "frozen" in the Position pop-up menu in the Position Tab. Igor freezes tags when it creates them for contour labels.
The interior/exterior setting used with textboxes does not apply to tags.
Tags Attached to Offscreen Points
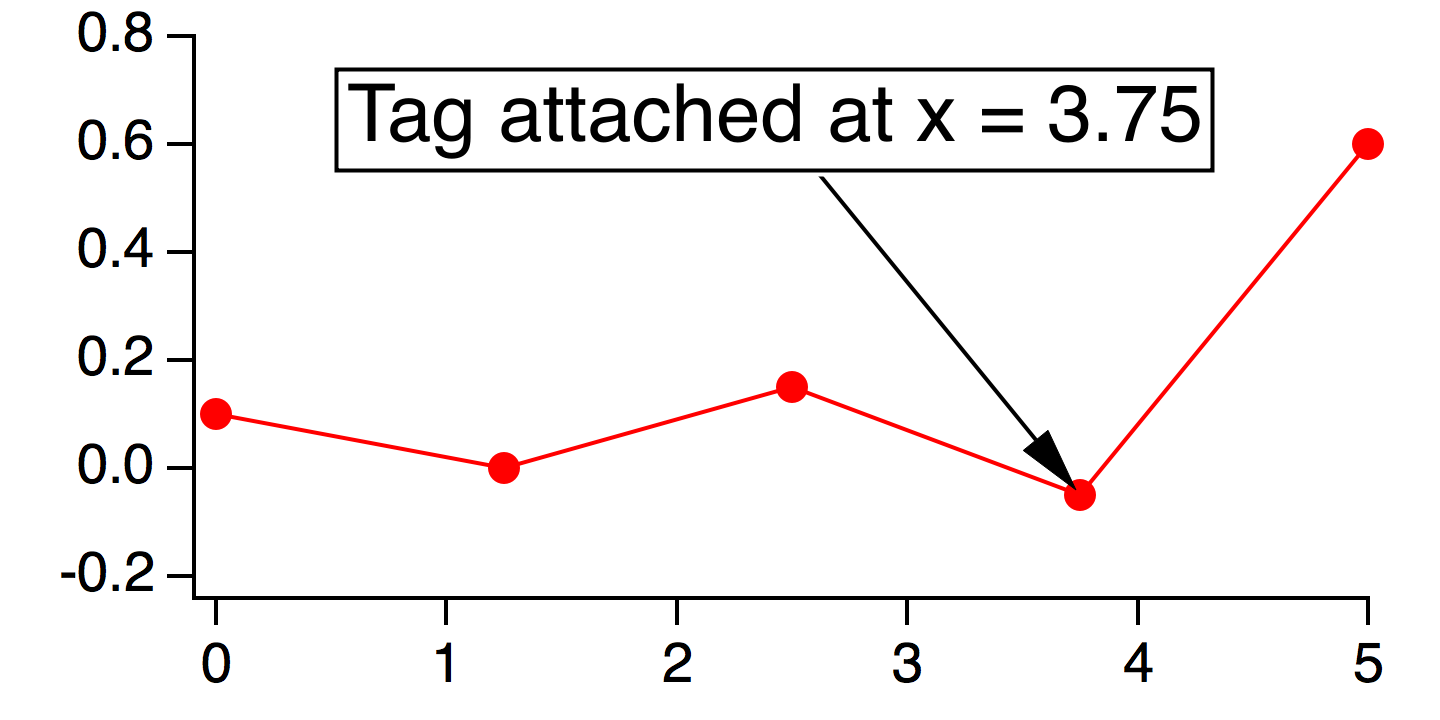
When only a portion of a wave is shown in a graph, it is possible that the attachment point of a tag isn't shown in the graph; it is "off screen" or "out-of-range".
This usually occurs because the graph has been manually expanded or the axes are not autoscaled. Igor draws the attachment line toward the offscreen attachment point.
In this example graph, the attachment point at x=3.75 falls within the range of displayed X axis values:
If we zoom the graph's X range to exclude the x=3.75 attachment point, the tag attachment point is offscreen but the tag is still drawn:
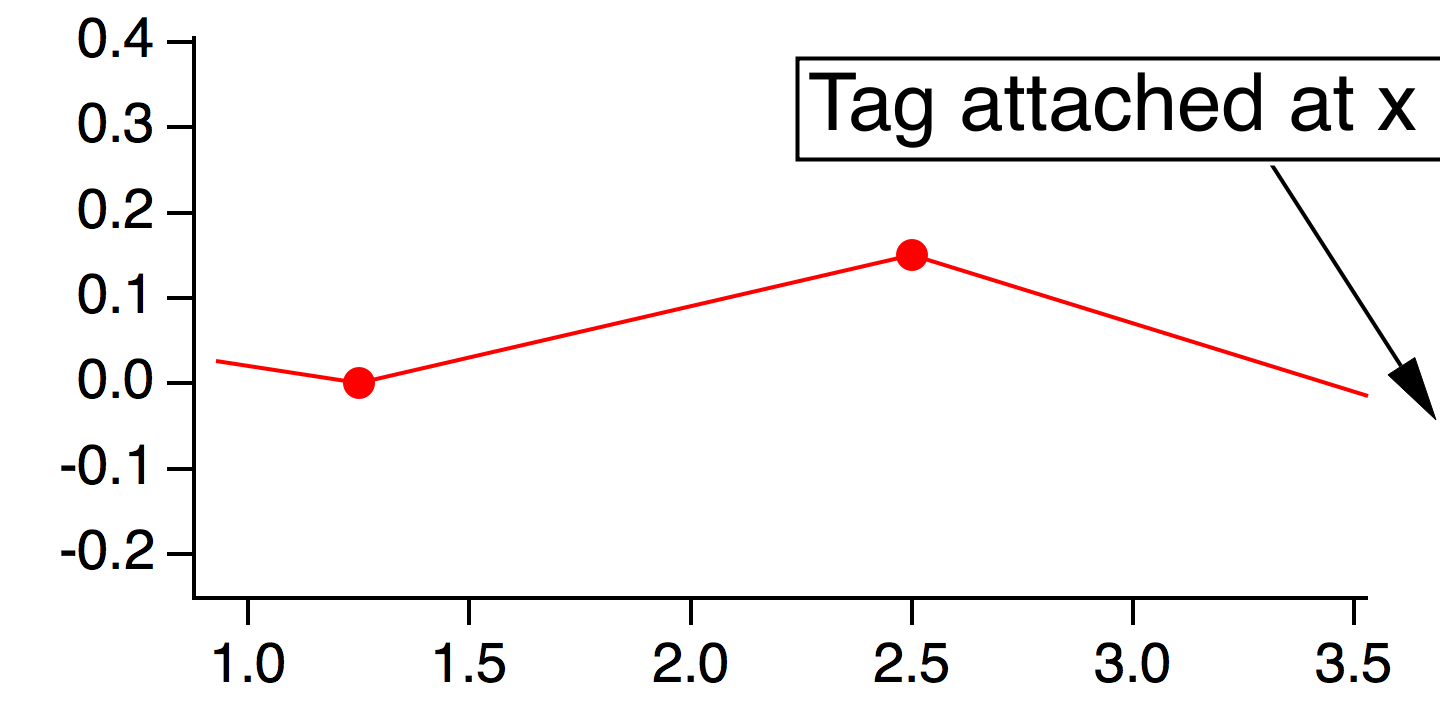
You can suppress the drawing of a tag whose attachment point is offscreen by choosing "hide the tag" from the If Offscreen pop-up menu in the Position tab.
If you want to see or modify a tag that is hidden, autoscale the graph so that it is no longer hidden.
Contour Labels Are Tags
Igor uses specialized tags to create the numerical labels for contour plots. The specialization adds a "tangent" feature to automatically orient the tag along the path of the contour lines. See Contour Labels for details.
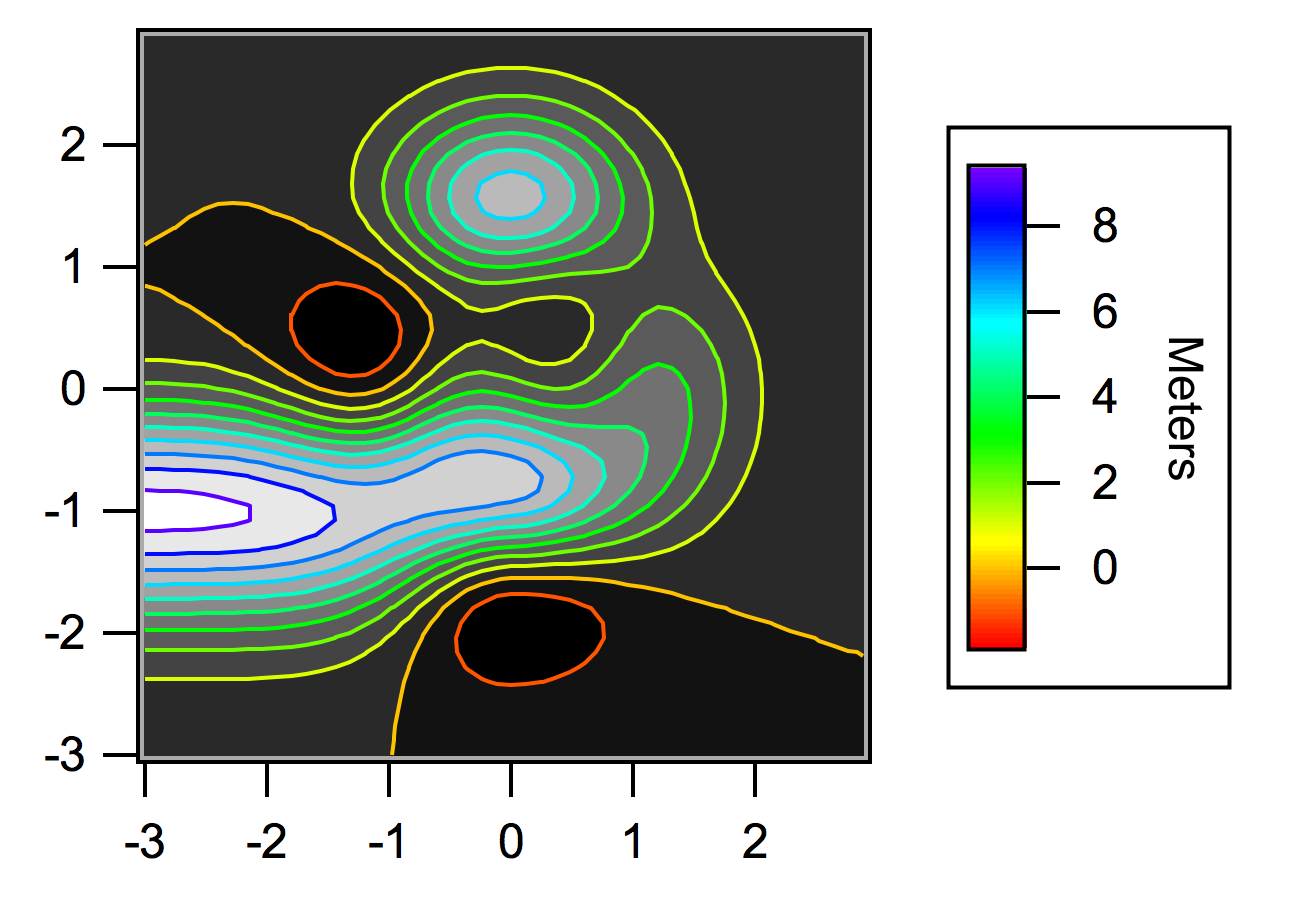
Color Scales
A color scale annotation summarizes the range of data using a color bar and one or more axes:
You create and modify color scales using the ColorScale operation which you can invoke via the Add Annotation and Modify Annotation dialogs.
ColorScale Main Tab
A color scale is associated with an f(z) trace, image plot, contour plot in a graph, the first surface object in a Gizmo plot, or with any color index wave or color table. This association can be changed in the ColorScale Main tab:
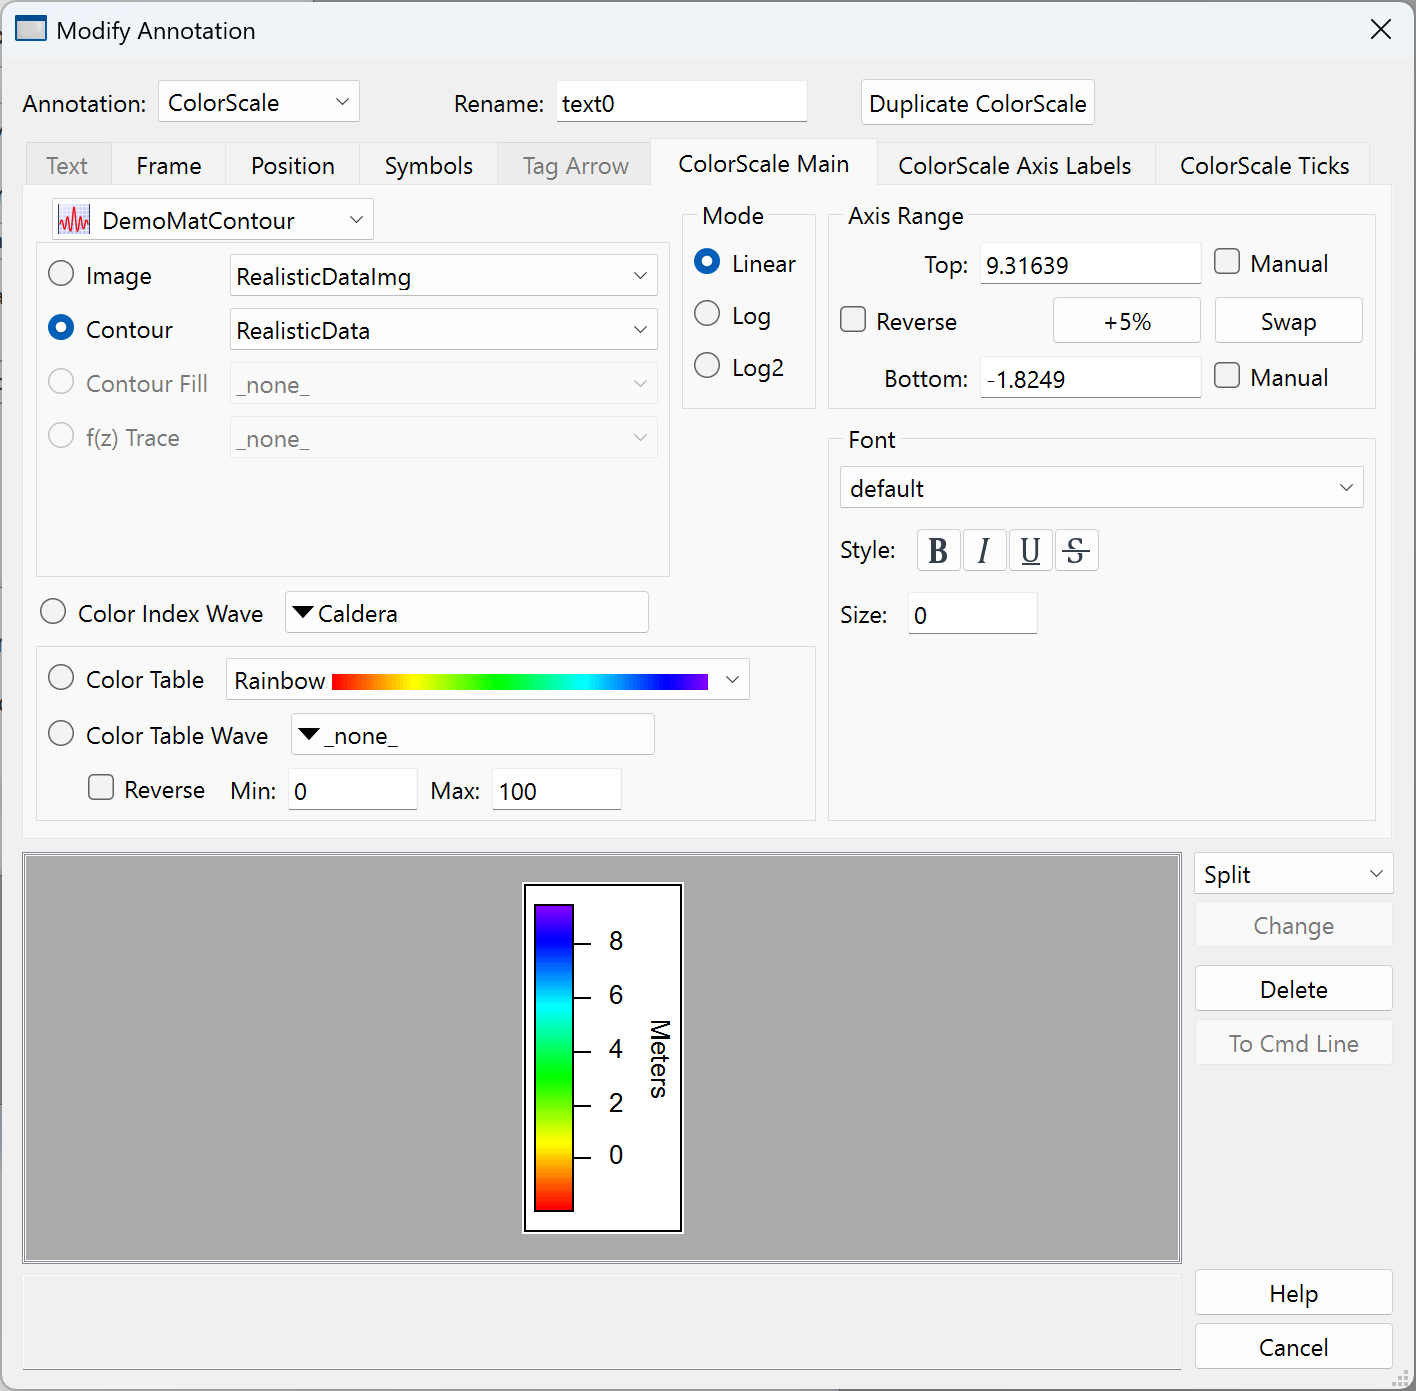
By choosing a graph or Gizmo plot from the pop-up menu, you can create a color scale based on an image, contour plot or f(z) trace in another graph or based on a surface plot in another Gizmo window.
ColorScale Size and Orientation
The size and orientation of the color scale is set in the dialog's Position tab.
The size of a color scale is indirectly controlled by the size and orientation of the "color bar" inside the annotation, and by the various axis and ticks parameters. The annotation adjusts itself to accommodate the color bar, tick labels, and axis labels.
When set to Auto or 0, the Width and Height settings cause the color scale to auto-size with the window along the color scale's axis dimension. Horizontal color scales auto-size horizontally but not vertically, and vice versa. The long dimension of the color bar is automatically maintained at 75% of the graph plot area or Gizmo plot dimension. The short dimension is set to 15 points.
You can enter a custom setting for either scale dimension in units of percent or points. Choosing Percent from the menu causes Igor to resiz the corresponding dimension in response to graph size changes. Choosing Points fixes the dimension so that it never changes.
ColorScale Axis Labels Tab
You set the axis label for the main axis, and for the second axis if any, in the ColorScale Axis Labels tab:
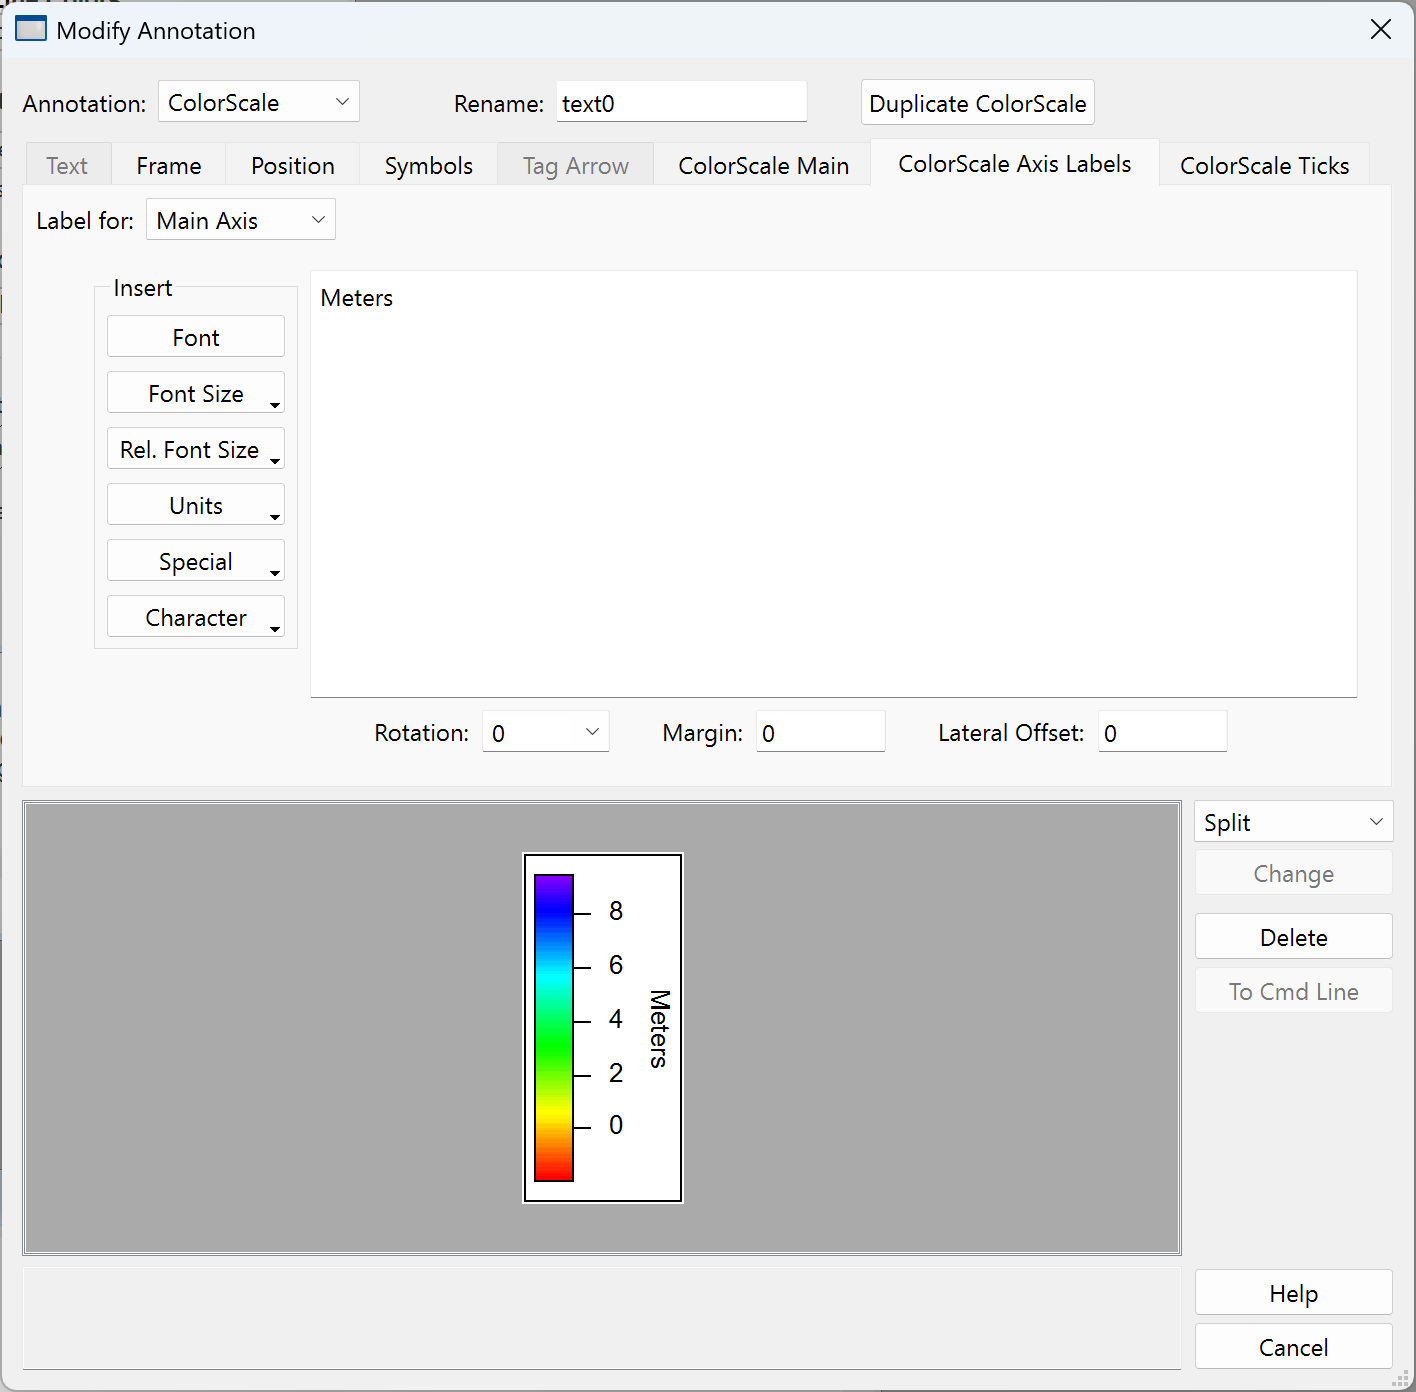
The axis label text is limited to one line. This text is the same as is used for text boxes, legends, and tags in the Text tab, but it is truncated to one line when the Annotation pop-up menu is changed to ColorScale.
The Units pop-up menu inserts escape codes related to the data units of the item the color scale is associated with. In the case of an image, contour or surface plot, the codes relate to the data units of the image, contour or surface matrix, or of an XYZ contour's Z data wave.
Rotation, Margin, and Lateral Offset adjust the axis label's orientation and position relative to the color axis.
The second axis label is enabled only if the Color Scale Ticks tab has created a second axis through user-supplied tick value and label waves.
ColorScale Ticks Tab
The color scale's axis ticks settings are similar to those for a graph axis:
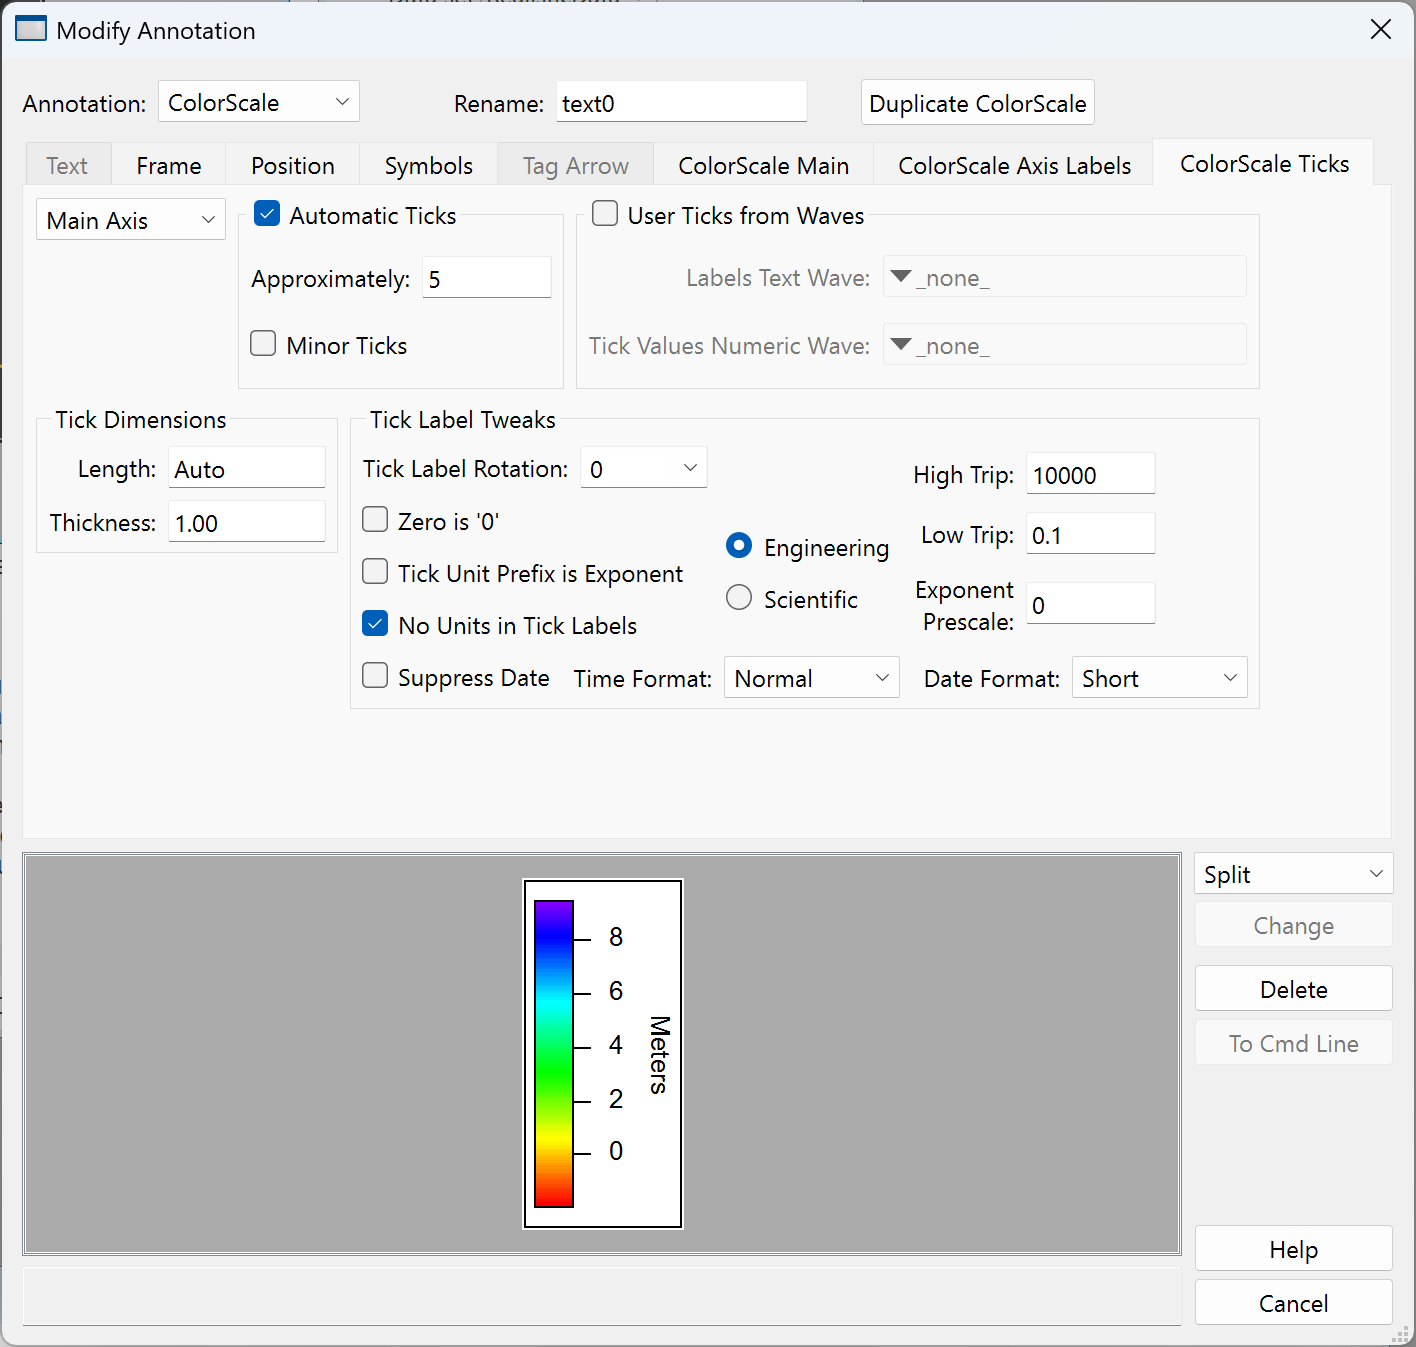
The main axis tick marks can be automatically computed by checking Automatic Ticks, or you can control tick marks manually by checking User Ticks from Waves. In the latter case, you provide two waves: one numeric wave which specifies the tick mark positions, and one text wave which specifies the corresponding tick mark labels.
You can also specify user-defined tick values and labels to create a second axis. This might be useful, for example, to display a temperature range in Fahrenheit and in Celsius. You do this by choosing Axis 2 from the pop-up menu that normally shows Main Axis. The second axis is drawn on the opposite side of the color bar from the main axis.
The Tick Dimensions settings apply to both axes. A length of -1 means Auto. Otherwise the dimensions are in points. To hide tick marks, set Thickness to 0.
Elaborate Annotations
It is possible to create elaborate annotations with subscripts, superscripts, and math symbols in Igor. Doing so requires entering escape codes. The Add Annotation dialog provides menus for inserting many of the escape codes that you might need.
This is feasible for relatively simple math expressions such as you might use for axis labels or to label graphs. For complex equations, you should use an Igor TeX formula or use a real equation editor and paste a picture representing the equation into an Igor graph or page layout.
Text Info Variables
The text info variable is a mechanism that allows Igor to insert escape codes that have a higher degree of "intelligence" than simple changes of font, font size, or style. Using text info variables, you can create quite elaborate annotations if you have the patience to do it. Since you need to know about them only to do fancy things, if you are satisfied with simple annotations, skip the rest of these Text Info Variable sections.
A text info variable saves information about a particular "spot" (text insertion point) in an annotation. Specifically, it saves the font, font size, style (bold, italic, etc.), and horizontal and vertical positions of the spot.
Each annotation has 10 text info variables, numbered 0 through 9. You can embed an escape sequence in an annotation's text to store information about the insertion point in a particular variable. Later, you can embed an escape sequence to recall part or all of that information. In the Label Axis and Add Annotation dialogs, there are items in the Font, Font Size and Special pop-up menus to do this.
See Text Info Variable Escape Codes for a list of available escape sequences.
Text Info Variable Example
To get a feel for this, let's look at a simple example. We want to create a textbox that shows the formula for the chemical compound ethanol: CH3CH2OH
To create a textbox showing this formula in 24 point type, we need to enter this, which consists of regular text plus escape codes (shown in red), in the Text tab of the Add Annotation dialog:
\Z24\[0CH\B3\MCH\B2\MOH
You can enter the escape codes by simply typing them or by making selections from the pop-up menus in the Insert section of the dialog. In this example, the font size escape code, \Z24, was generated using the Font Size pop-up menu and the rest of the escape codes were generated using the Special pop-up menu.
Here is what the escape codes mean:
| \Z24 | Set font size to 24 points. | |
| \[0 | Capture the current state as text info variable 0 (Text info variable 0 stores the "normal" state). | |
| \B | Subscript. | |
| \M | Return to normal state (as stored in text info variable 0). | |
| \B | Subscript. | |
| \M | Return to normal state (as stored in text info variable 0). | |
One way to enter this is to enter the regular text first and then add the escape codes. Here is what the annotation preview would show at each step of this process:
| CH3CH2OH | CH3CH2OH | |
| \Z24CH3CH2OH | CH3CH2OH (but in 24 point type) | |
| \Z24\[0CH3CH2OH | CH3CH2OH (no visible change) | |
| \Z24\[0CH\B3CH2OH | CH3CH2OH | |
| \Z24\[0CH\B3\MCH2OH | CH3CH2OH | |
| \Z24\[0CH\B3\MCH\B2OH | CH3CH2OH | |
| \Z24\[0CH\B3\MCH\B2\MOH | CH3CH2OH | |
Programming with Annotations
You can create, modify and delete annotations with the TextBox, Tag, Legend, and ColorScale operations. The AnnotationInfo function returns information about one existing annotation. The AnnotationList function returns a list of the names of existing annotations.
Changing Annotation Names
Each annotation has a name which is unique within the window it is in. You supply this name to the TextBox, Tag, Legend, ColorScale, and AnnotationInfo routines to identify the annotation you want to change.
You can rename an annotation by using the /C/N=oldName/R=newName syntax with the operations. For example:
TextBox/C/N=oldTextBoxName/R=newTextBoxName
Changing Annotation Types
To change the type of an annotation, apply the corresponding operation to the named annotation. For example, to change a tag or legend into a textbox, use:
TextBox/C/N=annotationName
Changing Annotation Text
To change the text of an existing annotation, identify the annotation using /N=annotationName, and supply the new text. For example, to supply new text for the textbox named text0, use:
TextBox/C/N=text0 "This is the new text"
To append text to an annotation, use the AppendText operation:
AppendText/N=text0 "and this text appears on a new line"
You can append text without creating a new line using the /NOCR flag.
Generating Text Programmatically
You can write an Igor procedure to create or update an annotation using text generated from the results of an analysis or calculation. For example, here is a function that creates or updates a textbox in the top graph or layout window. The textbox is named FitResults.
Function CreateOrUpdateFitResults(slope, intercept)
	Variable slope, intercept
	String fitText
	sprintf fitText, "Fit results: Slope=%g, Intercept=%g", slope, intercept
	TextBox/C/N=FitResults fitText
End
You would call this function, possibly from another function, after executing a CurveFit command that performed a fit to a line, passing coefficients returned by the CurveFit operation.
Deleting Annotations
To programmatically delete an annotation, use:
TextBox/K/N=text0
Annotation Escape Codes
Annotation escape codes provide formatting control and other features in annotations, including textboxes, tags, legends, and color scales. They can also be used in axis labels, control titles, SetVariable values using the styledText keyword, ListBox control contents, and with the DrawUserShape operation.
Using these escape codes you can control the font, size, style and color of text, create superscripts and subscripts, create dynamically-updated text, insert legend symbols, and apply other effects.
General Escape Codes
These escape codes are can be used in any text that supports annotation escape codes:
| \B | Subscript. | ||||||||
| \F'fontName ' | Use the specified font (e.g., \F'Helvetica'). | ||||||||
| \fdd | dd is a bitwise parameter with each bit controlling one aspect of the font style as follows: | ||||||||
| |||||||||
| See Setting Bit Parameters for details about bit settings. | |||||||||
| \JR | Right align text. | ||||||||
| \JC | Center align text. | ||||||||
| \JL | Left align text. | ||||||||
| \K(r, g, b ) | Use specified color for text. r, g and b are integers from 0 to 65535. | ||||||||
| You can optionally include a fourth alpha parameter which specifies opacity in the range 0 to 65535. | |||||||||
| \K also sets the marker fill color for markers added by \W. For setting the marker stroke color, use \k. | |||||||||
| \KB(r, g, b ) | Use specified color for text background. r, g and b are integers from 0 to 65535. | ||||||||
| You can optionally include a fourth alpha parameter which specifies opacity in the range 0 to 65535. | |||||||||
| Use \KB0; to turn background color off. | |||||||||
| \KB was added in Igor Pro 9.00. | |||||||||
| \k(r, g, b ) | Use specified color for marker stroke (line color). r, g and b are integers from 0 to 65535. Use before \Wtdd to change marker stroke color from the default of black (0,0,0). | ||||||||
| You can optionally include a fourth alpha parameter which specifies opacity in the range 0 to 65535. | |||||||||
| For setting the marker fill color for markers added by \W, use \K. | |||||||||
| \Ldtss | Draws a line from the x position specified in text info variable d to the current x position. Uses current text color. Thickness is encoded by digit t with values of 4,5,6 and 7 giving 0.25, 0.5, 1.0 and 1.5 pt. Line style is specified by 2 digit number ss. | ||||||||
| \M | Use normal (main) script (reverts to main line and size). | ||||||||
| \$PICT$name = pictName$/PICT$ | |||||||||
| Inserts specified picture. pictName can be a ProcPict or the name of a picture as listed in the Misc->Pictures dialog. This is useful for inserting math equations created by another program. | |||||||||
| \$WMTEX$ formula \$/WMTEX$ | |||||||||
| Inserts a math equation using a subset of LaTeX. See Igor TeX for details. | |||||||||
| \S | Superscript. | ||||||||
| \sa+dd | Adds extra space above line. dd is two digits in units of half points (1/144 inch). Can go anywhere in a line. | ||||||||
| \sa-dd | Reduces space above line. dd is two digits in units of half points (1/144 inch). Can go anywhere in a line. | ||||||||
| \sb+dd | Adds extra space below line. dd is two digits in units of half points (1/144 inch). Can go anywhere in a line. | ||||||||
| \sb-dd | Reduces space below line. dd is two digits in units of half points (1/144 inch). Can go anywhere in a line. | ||||||||
| \Wtdd | Draws a marker symbol using current font size and color. | ||||||||
| \Wtddd | Draws a marker symbol ddd using current font size and color. | ||||||||
| The marker outline thickness is specified by the one-digit number t with 1, 4, 5, 6, 7 and 8 giving 0.0, 0.25, 0.5, 1.0, 1.25 and 1.5 points. A t value of 1, which sets the outline thickness to zero, is useful only for filled markers as it makes unfilled markers disappear. | |||||||||
| The marker symbol number is specified by a two-digit number dd or a three-digit number ddd. New code should use the three-digit marker. | |||||||||
The three-digit syntax was added in Igor Pro 6.30 to support custom markers. This addition causes a two-digit dd escape sequence that is directly followed by a digit to be incorrectly interpreted. For example, the sequence:\W718500 mwas intended to display marker 18 followed by "500 m". It is now interpreted as a three-digit marker number (185) followed by "00 m". To fix this, change the two-digit marker number to a three-digit marker number by adding a leading zero, like this: \W7018500 m | |||||||||
| Use \k to set the marker stroke color. Use \K to set the marker fill color. | |||||||||
| \x+dd | Moves the current X position right by 2 * dd percent of the current font max width. | ||||||||
| \x-dd | Moves the current X position left by 2 * dd percent of the current font max width. | ||||||||
| \y+dd | Moves the current Y position up by 2 * dd percent of the current font height. | ||||||||
| \y-dd | Moves the current Y position down by 2 * dd percent of the current font height. | ||||||||
| \Znn | Use font size nn. nn must be exactly two digits. | ||||||||
| \Zrnnn | nnn is 3 digit percentage by which to change the current font size. nnn must be exactly three digits. | ||||||||
Tag Escape Codes
These escape codes are supported in tags only:
| \ON | Inserts the name of the wave to which the tag is attached. | |
| \On | Inserts the name of the trace and its instance number if greater than 0. | |
| \OP | Inserts the point number to which the tag is attached. | |
| \OX | Inserts the X value of the point to which the tag is attached. | |
| \OY | Inserts the Y value of the point to which the tag is attached. | |
| \OZ | Inserts the Z value of the point to which the tag is attached for contour level traces. Inserts NaN for other traces. | |
Text Info Variable Escape Codes
A text info variable is an internal Igor structure created by Igor. Using the escape codes described in this section, you can manipulate text info variables to create sophisticated annotations. These escape codes are can be used in any text that supports annotation escape codes.
Each annotation is created with 10 text info variables, numbered 0 through 9. Each text info variable is initialized to the default font, font size and style for the graph or page layout hosting the annotation. The X and Y positions are initially undefined.
For background information and an example, see Text Info Variables.
Here are the supported text info variable escape codes. <digit> means one of 0, 1, 2, ... 9:
| \[<digit> | Saves the font, size, style and current X and Y positions in the text info variable. | |
| \]<digit> | Restores all but the X and Y positions from the text info variable. | |
| \X<digit> | Restores the X position from the text info variable. | |
| \Y<digit> | Restores the Y position from the text info variable. | |
| \F]<digit> | Restores the font from the text info variable. | |
| \Z]<digit> | Restores the font size from the text info variable. | |
| \f]<digit> | Restores the style from the text info variable. | |
Text info variable 0 has a special property. It defines the "main" font size which is restored using the \M escape sequence. \M also sets the Y offset for the baseline to zero. No other text info variable 0 settings (font, style, or offsets) are set by \M.
Dynamic Text Escape Codes
Dynamic text allows you to create automatically updated annotations. The syntax for inserting dynamic text is:
\{dynamicText }
dynamicText may contain numeric and string expressions which reference global variables and waves and which invoke user-defined functions. Igor automatically reevaluates dynamicText when a global variable or a wave referenced directly in dynamicText or indirectly through a function call changes. It also reevaluates dynamicText whenever the annotation is updated.
The use of dynamic text creates dependencies that can be fragile and confusing. In most cases, it is better to generate static text programmatically, as described in Generating Text Programmatically.
You cannot reference local variables in dynamicText because local variables exist only while a procedure is executing and Igor must reevaluate it at other times.
The numeric and string expressions are evaluated in the context of the root data folder. Use the full data folder path of any non-root objects in the expressions.
dynamicText can take two forms, an easy form for a single numeric expression and a more complex form that provides precise control over the formatting of the result.
The easy form is:
\{ numeric-expression }
This evaluates the expression and prints with generic ("%g") formatting. For example:
TextBox "Two times PI is \\{2*PI}"
creates a textbox with this text:
Two times PI is 6.28319
The use of two backslashes in the TextBox literal string parameter is explained under Backslashes in Annotation Escape Sequences.
The full form is:
\{ formatStr, list-of-numeric-or-string-expressions }
formatStr and list-of-numeric-or-string-expressions are treated as for the printf operation. For instance, this example has a format string, a numeric expression and a string expression:
TextBox "\\{\"Two times PI is %1.2f, and today is %s\", 2*PI, date()}"
It produces this result:
Two times PI is 6.28, and today is Thu, April 9, 2015
You cannot use any other annotation escape codes in the format string or numeric or string expressions. They don't work within the \{ ... } context.
Also, the format string and string expressions do not support multiline text. If you need to use multiline text, use the technique described in Generating Text Programmatically.
As an aid in typing the expressions, Igor considers carriage returns between the braces to be equivalent to spaces. In the Add Annotation dialog, rather than typing:
\{"Two times PI is %1.2f, and today is %s",2*PI,date()}
you can type:
\{
	"Two times PI is %1.2f, and today is %s",
	2*PI,
	date()
}
Legend Symbol Escape Codes
You can insert a legend symbol in an annotation.
The syntax for inserting a symbol in a graph is:
\s(traceName)
The syntax for inserting a symbol in a page layout is:
\s(graphName.traceName)
\s is usually used in a legend, in which symbols are created and removed automatically, but can also be used in tags, textboxes, and axis labels where the symbol is updated, but not automatically added or removed. See Legends.
Axis Label Escape Codes
These escape codes are supported in axis labels and in axis tags:
| \c | Inserts the name of the wave that controls the axis. This is the first wave graphed against that axis. | |
| \E | Inserts power of 10 scaling with leading "x". This can be ambiguous and we recommend that you use either \U or \u. | |
| \e | Like \E but inverts the sign of the exponent. This can be ambiguous and we recommend that you use either \U or \u. | |
| \U | Inserts units with automatic prefixes | |
| \u | Inserts power of 10 scaling but without the leading "x" as used by \E. No action if axis is not scaled. Use in front of custom or compound unit strings. Example label: "Field Strength (\u Volts/Meter)" will produce something like "Field Strength (10⁶ Volts/Meter)". | |
| \u#1 | This is a variant of \u that inserts the inverse of \u (e.g., 10‾⁶ instead of 10⁶). | |
| \u#2 | Prevents automatic insertion of any units or scaling. Normally, if you set a wave's units and scaling, using the Change Wave Scaling dialog or SetScale operation, and if you do not explicitly specify an axis label, Igor will automatically generate an axis label from the units and scaling. \u#2 provides a way to suppress this behavior when it gets in the way. | |
Note that escape codes are case sensitive; \u and \U insert different substrings.
Backslashes in Annotation Escape Sequences
An annotation escape code is introduced by a backslash character. Because backslash is itself an escape character in Igor strings, when entering an escape code in a literal string, you need to enter two backslashes to produce one.
For example:
TextBox/C/N=text0 "\\Z14Bigger"
The Igor command parser converts "\" to a single backslash. The TextBox operation sees the single backslash and interprets \Z to mean that you want to change the font size.
The next example shows a case where you do not want a double-backslash:
TextBox/C/N=text0 "First line\rSecond line"
The Igor command parser converts "\r" to a carriage return character. The TextBox operation sees the carriage return character and interprets it to mean that you want to start a new line. There are no annotation escape codes in this example, just a regular escape code, so you must not use a double backslash.
The Add Annotation dialog generates a command to create an annotation. It knows the rules for backslashes. Consequently, if you use the Add Annotation dialog to create an annotation, you can see the correct use of backslashes by observing the command that it generates.
Igor TeX
As of Igor Pro 8, you can use a subset of LaTeX syntax to easily insert math formulas that would otherwise require tedious escape codes or the insertion of a picture generated by another program. LaTeX expressions are delimited by "\$WMTEX$" and "\$/WMTEX$" as illustrated here:
Display/W=(35,45,339,154)
TextBox/C/N=TeXTest/A=MC "\Z18" + "\\$WMTEX$ \frac{3x}{2} \\$/WMTEX$"
which creates

As this example shows, you need double backslashes in the opening and closing escape sequences ("\$WMTEX$" and "\$/WMTEX$"). Inside those escape sequences is TeX markup text in which double backslashes are not used ("\frac{3x}{2}").
In the Add Annotation and Modify Annotation dialogs, you can insert the opening and closing escape sequences by choosing the Igor TeX item in the Special pop-up menu. When using the dialogs, do not enter double backslashes as Igor does this for you as necessary.
The example above shows white space after the opening and before the closing escape sequence. Such white space is optional.
You can use local string variables to construct the annotation text. For example:
static StrConstant kTeXOpen = "\\$WMTEX$"
static StrConstant kTeXClose = "\\$/WMTEX$"
static StrConstant kTeXFontSize = "\Z18"

Function TeXTest()
	DoWindow/F TexTestGraph
	if (V_Flag == 0)
		Display /N=TexTestGraph /W=(35,45,339,154)
	endif

	String TeXFormula = "\frac{3x}{2}"
	String annotationText = kTeXFontSize + kTeXOpen + TeXFormula + kTeXClose
	TextBox/C/N=TeXTest/A=MC/F=0 annotationText
End
For more examples see the Igor TeX Demo experiment:
By default, formulas use an inline style. You can switch to a larger style that is commonly used for formulas on their own line by adding "\displaystyle" at the start of the TeX formula.
Igor Supports a Subset of TeX
Igor does not contain a full LaTeX interpreter. Rather it uses code patterned after Knuth's TeX.web with a subset that supports the most common math syntax that an Igor user is likely to use. Formulas are drawn directly using Igor's normal text and line drawing code — Igor does not first create a picture or .dvi file.
Igor's subset supports LaTeX's \frac but does not support standard TeX's \over and does not support macros. If you discover syntax that Igor does not support but really should, please let us know.
You can use \rm to force letters to be upright (rather than italic.) This is useful in chemical formulas such as ethanol: \rm CH_3CH_2OH
Fonts Used with Igor TeX
For purposes of determining what font is used, each component of a TeX formula is classified as one of these:
- A Greek letter specified by a TeX code like \alpha, \beta, and \gamma
- A math symbol specified by a TeX code like \neg, \prod, \sum, and \int
- Other text (letters, numbers, function names and anything else other than Greek letters and math symbols as defined above)
By default, Igor uses this font for components classified as Greek letters and math symbols:
- Symbol with backup Cambria Math
All other text is rendered using the font in effect in the annotation before the TeX formula.
The default Greek and math symbol fonts were chosen based on appearance and support for special characters such as square bracket extensions (used when building a tall square bracket).
You can override these defaults within a given annotation by storing a font name in text info variable 8 for Greek characters and text info variable 9 for math symbols. See Text Info Variables. You can experiment with different fonts using the Igor TeX Demo experiment.
Although you can use a Greek character such as α (alpha) directly, in order to use the specific font chosen for Greek character display, you should still use the \alpha syntax of TeX.
The fonts used in a formula affect not only the visual appearance of characters but also the font embedding situation when exporting to the graphics formats Igor PDF and EPSF. See Font Embedding (Windows). When exporting Igor PDF and EPSF with font embedding for standard fonts turned off, you should examine the output carefuly and use full font embedding if problems are found.
Igor TeX Demo
To learn about LaTeX syntax and capabilites: Open Igor TeX Demo Experiment
Igor TeX References
These web sites are useful for generating TeX formulas:
https://www.sciweavers.org/free-online-latex-equation-editor