Page Layouts
A page layout, or layout for short, is a type of window that you can use to compose pages containing:
- Graphs
- Tables
- 3D Gizmo plots
- Annotations (textboxes and legends)
- Pictures
- Drawing elements (lines, arrows, rectangles, polygons, etc.)
You create a layout by choosing New Layout from the Windows menu.
When the active window is a page layout window, the Layout menu appears in the main menu bar. It contains items that apply to page layout windows only.
You can use a page layout to make complex graphics for publication and slide shows for presentation. A layout can have multiple pages. You can have as many layout windows as memory allows.
Each page layout page has a number of layers. One layer, the layout layer, is for graphs, tables, 3D Gizmo plots, annotations and pictures. The other layers are for drawing elements. Drawing is discussed in detail in Drawing. This help file is primarily devoted to the layout layer.
Here are the notable features of page layouts:
- You can combine graphs, tables, 3D Gizmo plots, pictures, annotations and drawing elements.
- Graphs, tables, Gizmo plots and legends in layouts are updated automatically.
- Layouts can contain multiple pages.
- You can export all or part of a layout page to another program as a graphics file.
- You can use a layout to create a full-screen slide show.
There are two ways to add a graph, table or Gizmo plot to a page layout:
-
By creating a layout object in the layout layer. A layout object represents the contents of a standalone graph window, table window, or 3D Gizmo plot window. Layout objects are described under Page Layout Objects.
-
By creating an embedded graph, table or Gizmo plot subwindow in a drawing layer. Subwindows are described under Page Layout Subwindows.
The subwindow is a power-user feature. It is described in detail in Embedding and Subwindows. Graph, table and Gizmo objects are less powerful but simpler to use and more intuitive. We recommend using objects until you have had time to read and understand the Embedding and Subwindows section.
In this section, the term "object" refers to a graph, table, 3D Gizmo plot, annotation or picture object, not to a subwindow.
The following documentation discusses page layouts from the top down, covering these objects:
- Windows
- Pages
- Layers
- Layout objects (in the layout layer)
- Drawing elements (in the drawing layers)
- Subwindows (in the drawing layers)
Page Layout Windows
To create a page layout window, choose Windows→New Layout.
Page Layout Names and Titles
Every page layout window that you create has a name. This is a short Igor-object name that you or Igor can use to reference the layout from a command or procedure. When you create a new layout, Igor assigns it a name of the form Layout0, Layout1 and so on. You will most often use a layout's name when you kill and recreate the layout, see Killing and Recreating a Page Layout.
A layout also has a title. The title is the text that appears at the top of the layout window. Its purpose is to identify the layout visually. It is not used to identify the layout from a command or procedure. The title can consist of any text, up to 255 bytes.
You can change the name and title of a layout using the Window Control dialog. This dialog is a collection of assorted window-related things. Choose Window Control from the Control submenu of the Windows menu.
Hiding and Showing a Page Layout
You can hide a layout window by pressing the Shift key while clicking the close button.
You can show a layout window by choosing the layout's name from the Windows→Layouts submenu.
Killing and Recreating a Page Layout
Igor provides a way for you to kill a layout and then later to recreate it. Use this to temporarily get rid of a layout that you expect to be of use later.
You kill a layout by clicking the layout window's close button or by using the Close item in the Windows menu. When you kill a layout, Igor offers to create a window recreation macro. Igor stores the window recreation macro in the procedure window of the current experiment. You can invoke the window recreation macro later to recreate the layout. The name of the window recreation macro is the same as the name of the layout.
For further details, see Closing a Window and Saving a Window as a Recreation Macro.
Page Layout Zooming
You can zoom the page using the Zoom submenu in the Layout menu or the Zoom pop-up menu in the lower-left corner of the layout window.
By zooming out you see the entire page at once. You can zoom in to place drawing elements with higher precision.
Igor stores the position of layout objects with a precision of one point (nominally 1/72th of an inch, about 0.35 mm).
Page Layout Background Color
You can choose a background color for a page layout. This is useful for creating slides.
The background color applies to all pages of the page layout.
You can specify the background color by:
- Using the Background Color submenu in the Layout menu.
- Using the Background Color submenu in the Misc pop-up menu.
- Using the NewLayout command line operation.
- Using the ModifyLayout command line operation.
The background color is white by default. If you wish, after selecting a background color, you can capture your preferred background color by choosing Capture Layout Prefs from the Layout menu.
Page Layout Pages
Each page layout window can have any number of pages. You use the page sorter to add and delete pages.
The Page Sorter
The page sorter occupies the left side of the layout window. It provides an overview of all pages in the layout by displaying a thumbnail view of each page.
Right-clicking in the page sorter area displays a contextual menu from which you can add a page, insert a new page between existing pages, or delete existing pages. You can also add or delete pages using the controls at the bottom of the page sorter.
The editing area of the layout displays only one page at a time. The displayed page is called the "active page". You set the active page by clicking one of the thumbnails in the sorter. Igor identifies the active page by drawing a red outline around its thumbnail.
Although only one page can be active, you can select multiple pages. You would do this to delete or reorder multiple pages at a time. Igor identifies selected pages by drawing a darker outline around their thumbnails.
Starting from a single selected page, you can select a range of pages by clicking on a non-selected thumbnail while pressing the shift key. Alternatively, you can select or deselect individual pages by pressing the control key while clicking the corresponding thumbnail.
To change the order of pages, select one or more thumbnails and drag them to the desired place in the sorter.
You can also manipulate the pages in a layout programatically using the LayoutPageAction operation.
You can resize the page sorter by dragging the divider between it and the page editing area to the left or right. Dragging the divider all the way to the left hides the page sorter entirely.
Page Layout Page Sizes
Each layout stores a global page size and page margins. You can also set the size and margins for specific individual pages. The global page size and margins apply to any page in the layout for which you have not set an explicit size. You can set both the global and the per-page dimensions using the Layout Page Size dialog via the Layout menu, or using the LayoutPageAction operation.
When it is created, a layout is given a default page size and page margins based on preferences. You can change these default dimensions by setting the global dimensions for a page layout and choosing Layout→Capture Layout Prefs.
Compatibility with Previous Versions of Igor
Page layouts were originally conceived, decades ago, primarily for use in printing hard copy. Because of this, in Igor Pro 6 and earlier versions, the layout page size was controlled using the system Page Setup dialog, which is part of the printing system.
Over time, the use of hard copy has diminished, replaced by on-screen formats such as HTML and PDF. It is more common now to create graphics for display in a web page or for inclusion in an electronic document to be sent to a journal editor. For these purposes, you usually need to control the size of the graphics independent of any paper size.
Consequently, in Igor Pro 7 and later, each layout has its own size setting that is independent of the page setup. The page setup affects printing of the layout only, not the size of the page on the screen or when exported. Because of this change, a layout created in Igor 7 or later may appear with a different size when opened in Igor 6.
You may be accustomed to controlling the size of a page layout page using File→Page Setup. In Igor 7 and later, you need to use Layout→Page Size instead.
An ancillary benefit of this change is that it eliminates operating-system dependencies, making behavior across platforms more consistent.
Printing Page Layouts
When you print a page layout, Igor aligns the top/left corner of the layout page, as set in the Layout Page Size dialog, with the top/left corner of the printer's printable area, as set in the Page Setup dialog. The printer's printable area is controlled by the printer margins as set in the Page Setup dialog.
You can preview the printed output using the Print Preview dialog from the File menu.
Page Layout Layers
A page in a layout has six layers. There is one layer for layout objects, four layers for drawing elements, and one layer (not shown in this graphic) for user-interface elements:

The two icons in the top-left corner of the layout window control whether you are in layout mode or drawing mode.

The layout layer is most useful for presenting multiple graphs and for annotations that refer to multiple graphs. The drawing layers are useful for adding simple graphic elements such as arrows between graphs.
The top layer (not shown in the graphic above) is the Overlay layer. It is provided for programmers who wish to add user-interface drawing elements without disturbing graphic elements. It is not included when printing or exporting graphics. This layer was added in Igor Pro 7.00.
Activating the Layout Layer
When you click the layout mode icon, the layout layer is activated. You can use the layout tools to add objects to or modify objects in the layout layer only.
Activating the Current Drawing Layer
When you click the drawing mode icon, the current drawing layer is activated. You can use the drawing tools to add elements to or modify elements in the current drawing layer only.

Changing the Current Drawing Layer
Initially, the UserFront drawing layer will be the current drawing layer. To select a different drawing layer, click the layer tool and select the layer from the pop-up menu.
You may never need to use the drawing layer pop-up menu. Most users will need to use just the layout layer and the UserFront drawing layer. The ProgFront and ProgBack layers are intended to be used from Igor procedures only.
If you click an element that is not in the active layer, Igor ignores the click.
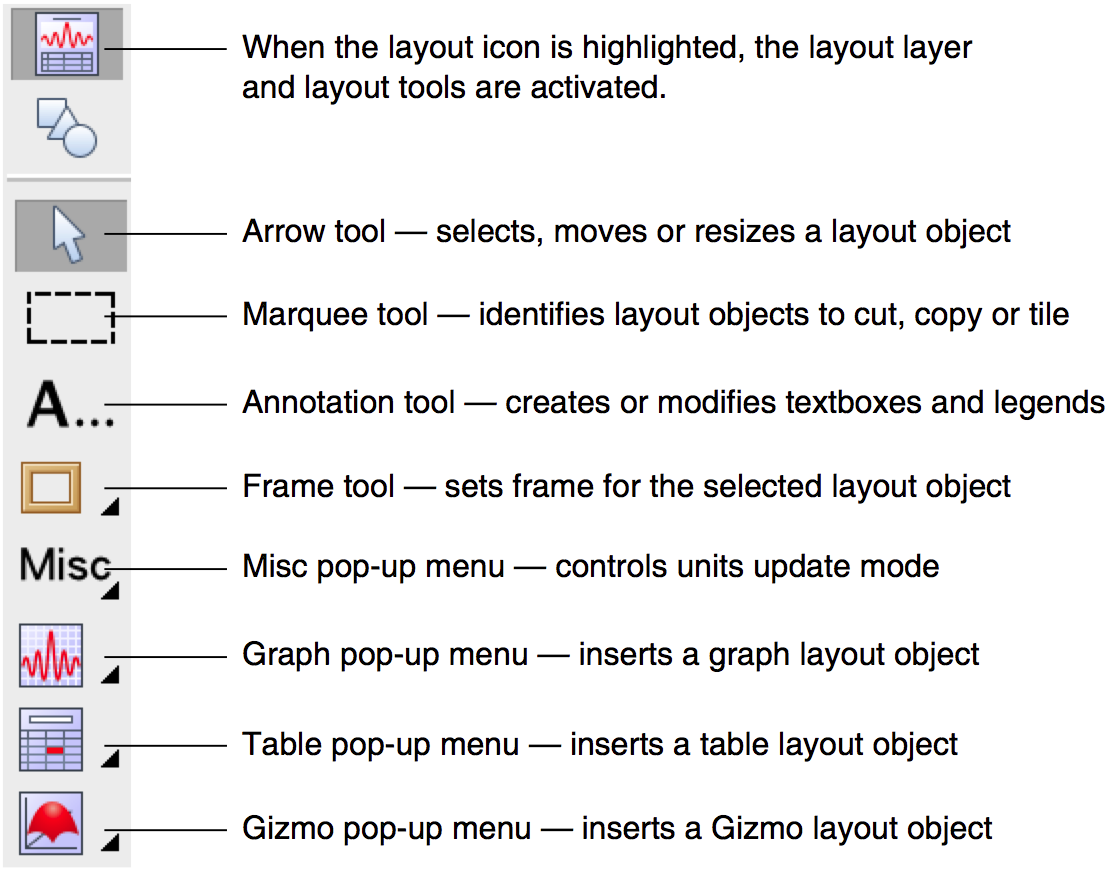
The Layout Layer Tool Palette
When you click the top icon in the tool palette, Igor displays the tools for the layout layer.
The Arrow Tool
When you click the arrow tool, it becomes highlighted. The arrow tool is used to select, move or resize a graph, table, annotation or picture object. To select an object, click it. Adjustment handles appear on the selected object.
When you position the cursor over an object, the info panel shows the name of the object under the cursor. If you click and drag, the object will follow the cursor as you drag it. While you drag, the info panel shows the left and top coordinates of the object as well as its width and height. If you press Shift while dragging an object, the direction of movement is constrained either horizontally, vertically, or diagonally, depending on the motion direction. You must press Shift after clicking the object - otherwise the Shift-click will deselect it.
You can set the object's width and height by dragging the selected object's handles. While you drag, the info panel shows the width and height of the object.
When you adjust the size of a table and then release the mouse, the table is auto-sized to an appropriate integral number of rows and columns.
You can quickly force an annotation or picture back to its unadjusted size (100% by 100%) by pressing Alt and double-clicking the object.
Double-clicking an object while the arrow tool is selected brings up the Modify Objects dialog, described in Modifying Layout Objects. This dialog sets the object's properties.
To select multiple objects, click to select the first object and Shift-click to select other objects. Alternatively, you can click in the page and drag diagonally. If you Shift-click an object that is already selected, it becomes deselected.
When two or more objects are selected, you can align them using the Align submenu in the Layout menu. You can also make the widths, heights, or widths and heights of the selected objects the same using items in the Layout menu. In all of these actions, the first object that you select is used as the basis for aligning or resizing other objects. Click in a blank area of the page to deselect all objects. Then click the object whose position or size you want to replicate. Now Shift-click to select additional objects. Finally, choose the desired action from the Layout menu.
While an object is selected, you can control its front-to-back ordering in the layout layer by choosing Bring to Front, Move Forward, Send to Back or Move Backward from the Layout menu. This changes the order of objects within the layout layer only. It has no effect on the drawing layers.
If you select a graph, table or 3D Gizmo object, you can then double-click the name of the object in the info panel at the bottom of the layout window. This activates the associated graph or table window.
With multiple objects selected, you can perform the following actions:
-
Delete the objects, by pressing Delete or using the Edit→Clear menu item.
-
Copy the objects, using Edit→Copy.
-
Cut the objects, using Edit→Cut.
-
Drag the objects to a new location.
-
Nudge the objects with the arrow keys.
-
Change the frame on the objects using the frame tool.
You cannot do the following actions on multiple objects:
-
Change the order of the objects in the object list (move to front, move to back).
-
Adjust the size of the objects using the mouse.
The Marquee Tool
When you click the marquee tool, it becomes highlighted and the cursor changes to a crosshair. You can use the marquee tool to identify multiple objects for cutting, copying, clearing or arranging. You can also use it to indicate a part of the layout for export to another application and to control pasting of objects from the clipboard.
To use the marquee tool, click the mouse and drag it diagonally to indicate the region of interest. Igor displays a dashed outline around the region. This outline is called a marquee. A marquee has handles and edges that allow you to refine its size and position.
To refine the size of the marquee, move the cursor over one of the handles. The cursor changes to a double arrow which shows you the direction in which the handle adjusts the edge of the marquee. To adjust the edge, simply drag it to a new position.
To refine the position of the marquee, move the cursor over one of the edges away from the handles. The cursor changes to a hand. To move the marquee, drag it.
To make it possible to export any section of a layout, an object is considered selected if it intersects the marquee. This is in contrast to selection with the arrow tool, which requires that you completely enclose the object.
This table shows how to use the marquee.
| To Accomplish This | Do This |
|---|---|
| Cut, copy or clear multiple objects | Drag a marquee around them and then use the Edit menu to cut, copy or clear. |
| Paste objects into a particular area | Drag a marquee where you want to paste and then use the Edit menu to paste. |
| Tile or stack objects | Drag a marquee to indicate the area into which you want to tile or stack and then choose Arrange Objects from the Layout menu. |
| Export a section of the layout as a picture | Drag a marquee to indicate the section that you want to export and then choose Export Graphics from the Edit menu (to use the clipboard) or choose Save Graphics from the File menu (to save in a disk file). |
When you click inside the marquee Igor presents a pop-up menu, called the layout Marquee menu, from which you can choose Cut, Copy, Paste, or Clear. This cuts, copies, pastes or clears the all objects that intersect the marquee. These marquee items do the same thing as the corresponding items in the Edit menu.
The Marquee menu also contains items that allow you to insert a subwindow.
It is possible to add your own menu items to the layout Marquee menu. See Marquee Menus for details.
See Copying Objects from the Layout Layer and Pasting Objects into the Layout Layer for more details on copying and pasting. See Arranging Layout Objects for details on tiling and stacking.
When the marquee tool is selected, any selected object is deselected. Double-clicking while the marquee tool is selected has no effect.
The Annotation Tool
When you click the annotation tool, it becomes highlighted and the cursor changes to an I-beam. The annotation tool creates new annotations or modifies existing annotations. Annotations include textboxes, legends, and colorscales.
Clicking an existing annotation invokes the Modify Annotation dialog. Clicking anywhere else on the page invokes the Add Annotation dialog which you use to create a new annotation. See Page Layout Annotations for details.
The Frame Pop-Up Menu
When an object is selected, you can change its frame by choosing an item from the Frame pop-up menu. Each object can have no frame or a single, double, triple or shadow frame.
When you change the frame of a graph, table or picture object, its outer dimensions (width and height) do not change. Since the different frames have different widths, the inner dimensions of the object do change. In the case of graphs this is usually the desired behavior. For tables, changing the frame shows a non-integral number of rows and columns. You can restore the table to an integral number of rows and columns by pressing Alt and double-clicking the table. For pictures, changing the frame slightly resizes the picture to fit into the new frame. To restore the picture to 100% sizing, press Alt and double-click the picture.
When you change the frame of an annotation object, Igor does change the outer dimensions of the object to compensate for the change in width of the frame.
Misc Pop-Up Menu
The Misc pop-up menu adjusts some miscellaneous settings related to the layout.
You can choose Points, Inches, or Centimeters. This sets the units used in the info panel.
You can turn the DelayUpdate item on or off. If DelayUpdate is on, when a graph or table which corresponds to an object in the layout changes, the layout is not updated until you activate it (make it the front window). If DelayUpdate is off, then changes to graphs or tables are reflected immediately in the layout. This also affects drawing commands. As of Igor Pro 10, the DelayUpdate setting defaults to off.
DelayUpdate does not affect embedded graph and table subwindows.
DelayUpdate is a global setting that affects all existing and future layouts. When you change it in one layout, you change it for all layouts in all experiments.
You can use the Background Color submenu to change the layout's background color. See Page Layout Background Color for details.
Graph Pop-Up Menu
The Graph pop-up menu provides a handy way to append a graph object to the layout layer. It contains a list of all the graph windows that are currently open. Choosing the name of a graph appends the graph object to the layout layer. The initial size of the graph object in the layout is taken from the size of the graph window.
Table Pop-Up Menu
The Table pop-up menu provides a handy way to append a table object to the layout layer. It contains a list of all the table windows that are currently open. Choosing the name of a table appends the table object to the layout layer.
Gizmo Pop-Up Menu
The Gizmo pop-up menu provides a handy way to append a 3D Gizmo plot object to the layout layer. It contains a list of all the Gizmo windows that are currently open. Choosing the name of a Gizmo window appends the Gizmo object to the layout layer.
The Layout Layer Contextual Menu
When the layout layer is active, right-clicking displays the Layout contextual menu. The contents of the menu depend on whether you click directly on an object or on a part of the page where there is no object.
Layout Contextual Menu For a Single Object
If you Control-click or right-click directly on an object, the layout contextual menu includes these items:
Activate Object's Window
Activates the graph, table, or Gizmo plot window associated with the object.
Recreate Object's Window
Recreates the graph, table, or Gizmo plot window associated with the object by running the window recreation macro that was created when the window was killed.
Kill Object's Window
Kills the graph, table, or Gizmo plot window associated with the object. Before it is killed, Igor displays a dialog that you can use to create or update its window recreation macro.
Show Object's Window
Shows the corresponding window if it is hidden.
Hide Object's Window
Hides the corresponding window if it is visible.
Scale Object
Changes the size of the layout object in terms of percent of its current size or percent of its normal size. Although this can work on any type of object, it is most useful for scaling pictures relative to their normal size.
For a picture or annotation object, "normal" size is the inherent size of the picture or annotation before any shrinking or expanding. For a graph, table or Gizmo object, "normal" size means the size of the corresponding window.
If a graph's size is hardwired via the Modify Graph dialog, the corresponding layout object cannot be scaled.
You can quickly return a picture or annotation to its normal size by double-clicking it while pressing Alt.
Convert Object to Embedded
Converts a graph, table or Gizmo object to an embedded subwindow. In doing so, the standalone window which the object represented is killed, leaving just the embedded subwindow.
Layout Contextual Menu For Selected Objects
If you Control-click or right-click on a part of the page where there is no object while objects are selected, the Layout contextual menu includes these items:
Recreate Selected Objects' Windows
Runs the recreation macro for each selected graph, table or Gizmo object for which the corresponding window was killed.
Kill Selected Objects' Windows
Kills the window corresponding to each selected graph, table, and Gizmo object. Before each window is killed, Igor displays a dialog that you can use to create or update its window recreation macro.
Show Selected Objects' Window
Shows the corresponding windows if they are hidden.
Hide Selected Objects' Window
Hides the corresponding windows if they are visible.
Scale Selected Objects
Changes the size of each selected layout object in terms of percent of its current size or percent of its normal size.
Page Layout Objects
The layout layer of a page layout page can contain five kinds of objects representing graph windows, table windows, 3D Gizmo plot windows, annotations, and pictures. The term "layout object" references these objects in the layout layer only, not drawing elements or subwindows in other layers.
This table shows how you can add each of these objects to the layout layer.
| Object Type | To Add Object to the Layout Layer |
|---|---|
| Graphs | Use the Graph pop-up menu in the layout window. |
| Use the Append to Layout dialog. | |
| Use the AppendLayoutObject operation. | |
| Tables | Use the Table pop-up menu in the layout window. |
| Use the Append to Layout dialog. | |
| Use the AppendLayoutObject operation. | |
| 3D Gizmo Plots | Use the Gizmo pop-up menu in the layout window. |
| Use the Append to Layout dialog. | |
| Use the AppendLayoutObject operation. | |
| Annotations | Click on the text (A) tool and then click in the page area. |
| Use the Add Annotation dialog. | |
| Use the Textbox or Legend operations. | |
| Pictures | Paste from the clipboard. |
| Use the Pictures dialog (Misc menu). | |
| Use the AppendLayoutObject operation if the picture already exists in the current experiment's picture gallery. |
Layout Object Names
Each object in the layout layer has a name so that you can manipulate it from the command line or from an Igor procedure as well as with the mouse. When you position the cursor over an object, its name, position and dimensions are shown in the info panel at the bottom of the layout window.
For a graph, table, or Gizmo object, the object name is the same as the name of the corresponding window. For an annotation, the object name is determined by the Textbox or Legend operation that created the annotation. When you paste a picture from the clipboard into a page layout, Igor automatically gives it a name like PICT_0 and adds it to the current experiment's picture gallery which you can see by choosing Misc→Pictures.
Layout Object Properties
This table shows the properties of each object in the layout layer.
| Object Property | Comment |
|---|---|
| Left coordinate | Measured from the left edge of the paper. |
| Set using mouse or Modify Objects dialog. | |
| Top coordinate | Measured from the top edge of the paper. |
| Set using mouse or Modify Objects dialog. | |
| Width | Set using mouse or Modify Objects dialog. |
| Height | Set using mouse or Modify Objects dialog. |
| Frame | None, single, double, triple, or shadow. |
| Set using Frame pop-up menu or Modify Objects dialog. | |
| Transparency | Set using Modify Objects dialog. |
All of the properties can also be set using the ModifyLayout operation from the command line or from an Igor procedure.
Appending a Graph, Table or Gizmo Plot to the Layout Layer
You can append graphs, tables and 3D Gizmo plots to a layout by choosing the Append to Layout item from the Layout menu or by using the pop-up menus in the layout's tool palette.
Removing Objects from the Layout Layer
You can remove objects from a layout by choosing the Remove from Layout item from the Layout menu.
You can also remove objects by selecting them and choosing Edit→Clear or Edit→Cut.
Removing a picture from a layout does not remove it from the picture gallery. To do that, use the Pictures dialog.
Modifying Layout Objects
You can modify the properties of layout objects using the Modify Objects dialog. To invoke it, choose Modify Objects from the Layout menu or double-click an object with the layout layer arrow tool.
The effect of each property is described under Layout Object Properties.
Once you have modified an object you can select another object from the Object list and modify it.
Automatic Updating of Layout Objects
Graph, table and Gizmo objects are dynamic. When the corresponding window changes, Igor automatically updates the layout object. Also, if you change the symbol for a wave in a graph, and if that symbol is used in a layout legend, Igor automatically updates the legend.
As of Igor Pro 10, Igor will automatically update the layout after any change. If your layouts are extremely data intensive or if your computer is very slow, you can have Igor wait to do the update until the layout window is activated. To set the DelayUpdate setting, select it in the Misc pop-up menu of the layout's tool palette.
Dummy Objects
If you append a graph, table, or 3D Gizmo plot to the layout layer, this creates a layout object corresponding to the window. If you then kill the original window, the layout object remains and is said to be a "dummy object". A dummy object can be moved, resized or changed just as any other object.
If you later recreate the window or create a new window with the same name as the original, the object is reassociated with the window and ceases to be a dummy object.
Arranging Layout Objects
This section applies to layout objects in the layout layer only, not to drawing elements or subwindows.
Front-To-Back Relationship of Objects
New objects added to the layout layer are added in front of existing objects. You can move objects in front of or in back of other objects using the Layout menu after selecting a single object with the arrow tool.
These menu commands affect the layout layer only. To put drawing elements in front of the layout layer, use the User Front drawing layer. To put drawing elements behind the layout layer, User Back drawing layer.
Tiling Layout Objects
You can tile or stack objects in a layout by choosing the Arrange Objects item from the Layout menu. This displays the Arrange Objects dialog. The rest of this section refers to that dialog.
Click the Tile radio button to do tiling instead of stacking.
When you tile objects, Igor needs to know the following:
-
Which objects you want to tile
-
The area of the page into which you want to tile the objects
-
The number of rows and columns of tiles that you want
-
The spacing between tiles (grout)
You can specify all of this information via the Arrange Objects dialog.
In most cases, it is worthwhile for you pre-arrange the objects to be tiled in roughly the desired sizes and positions and select those objects before summoning the dialog. This facilitates using features of the dialog to precisely arrange the objects.
Before we get into details, we will look at a simple example that demonstrates tiling concepts.
Layout Tiling Guided Tour
In this tour, we will create a page layout displaying some graphs and arrange them using tiling.
We assume that we are creating the layout to produce a graphic of a specific size for use on a web page or in a paper, not for printing hard copy.
We start by making some graphs to tiled and then create a page layout containing the graphs.
-
In a new experiment, execute the following commands:
Make/O jack=sin(x/8), fred=cos(x/8), bob=jack*fred
Display/W=(35,50,300,175) jack
Display/W=(35,200,300,325) fred
Display/W=(35,350,300,475) bob
Layout/W=(350,50,850,650) Graph0, Graph1, Graph2
ModifyLayout mag=1, units=0 -
If necessary, adjust the layout magnification and window size so you can see the entire page.
Next we will set the page size and margins appropriate for using in a web page or paper.
-
Choose Layout→Page Size, enter the following settings, and click Do It:
Units: Points
Width: 432
Height: 360
Margins: 0 for all
Margins are useful when printing but usually serve no purpose when creating graphics for a paper or web page.
-
Choose Layout→Append to Layout and append Graph0, Graph1, and Graph2.
-
Use Edit→Select All to select all of the graph objects in the layout.
-
Choose Layout→Arrange Objects.
Click the Tile radio button.
Set the other settings as follows:
Grout: 8
Rows: Auto
Columns: Auto
Click Do It.
The graphs are tiled in a 2 row by 2 column arrangment leaving the bottom/right tile empty.
Suppose we want to leave the bottom/left tile empty rather than the bottom right.
-
Drag the bottom/left graph and position it roughly in the bottom/right position.
Use Edit→Select All to select all of the graph objects.
Choose Layout→Arrange Objects.
Check the Preserve Arrangement checkbox.
Click Do It.
The Preserve Arrangement feature tiled the last graph in the bottom/right position as you had roughly positioned it.
Next we will assume that you want to use just a portion of the page rather than the whole thing, perhaps to leave room for textboxes or other objects.
-
Click the Misc icon in the tool palette and choose Points.
Click a blank area of the page to deselect all objects.
Drag the top/left graph down until its top edge is at 72 points (as displayed in the T section of the layout status panel)
Shift-click to select the top/right graph also and choose Layout→Align→Top Edges.
Shift-click to select the bottom/right graph also.
Choose Layout→Arrange Objects.
Check the Use Bounding Box checkbox.
Click Do It.
Now Igor has tiled the objects into the bounding box surrounding the selected graph objects. The bounding box is the smallest rectangle that encompasses all of the objects to be tiled.
We have left the top 72 points of the layout open for use by textboxes or other objects.
Next we will see how to do the same thing but using the marquee instead of the bounding box and leaving 36 points instead of 72 points of free space at the top.
The marquee tool is a dashed rectangle. It appears below the arrow tool and above the Annotation tool in the page layout tool palette.
To drag out a marquee, click in the page and drag diagonally. The marquee coordinates are displayed in the layout status panel at the bottom of the layout window.
The marquee has draggable handles on the corners and in the middle of each side that you can use for fine tuning its position.
-
Click the Marquee tool and drag out a marquee that roughly fills the entire page.
Position the mouse over the top handle and drag it so that the top is positioned at 36 points as shown in the T section of the layout status panel.
Drag the left, bottom, and right marquee handles to the corresponding page edges.
Choose Layout→Arrange Objects.
Uncheck the Use Bounding Box checkbox to enable the Use Marquee checkbox.
Click Do It.
Now Igor has tiled the objects into the area specified by the marquee.
This concludes the layout tiling guided tour.
Selecting Tiling Objects
There are several ways to specify which objects to arrange. The easiest is to select the objects in the page layout before summoning the Arrange Objects dialog. The selected objects will then be selected in the Objects to Arrange list.
Alternatively, you can select objects in the list directly. Objects are tiled in the order in which you select them.
Finally you can include objects to be tiled using the various dialog checkboxes such as All Graphs Too and All Tables Too.
If you select no objects in the list and select none of the checkboxes, then all of the objects in the layout will be arranged.
Specifying the Tiling Area
You can specify the tiling area by clicking the marquee tool and dragging out a marquee. Then when you enter the dialog, the Use Marquee checkbox will be checked and enabled.
Alternatively, you can pre-position the objects so that their bounding box defines the tiling area. The bounding box is the smallest rectangle that completely encloses all of the objects to be tiled. To use this technique, roughly pre-position the objects. Next precisely adjust the positions of the left-most, top-most, right-most, bottom-most edges. Select the objects to be tiled, summon the dialog, and check the Use Bounding Box and Preserve Arrangement checkboxes. See Layout Tiling Guided Tour for an example.
If you uncheck both Use Marquee and Use Bounding Box, the tiling area is the entire page.
Setting the Number of Rows and Columns
You can set the number of rows and columns of tiles or you can leave them both on auto. If auto, Igor figures out a nice arrangement based on the number of objects to be tiled and the available space. Setting rows or columns to zero is the same as setting it to auto.
If you set both the rows and columns to a number between 1 and 100, Igor tiles the objects in a grid determined by your row/column specification. If you set either rows or columns to a number between 1 and 100 but leave the other setting on auto, Igor figures out what the other setting should be to properly tile the objects. In all cases, Igor tiles starting from the top-left cell in a grid defined by the rows and columns, moving horizontally first and then vertically.
If the grid that you specify has fewer tiles than the number of objects to be tiled, once all of the available tiles have been filled, Igor starts tiling from the top-left corner again.
Setting the Space Between Tiles
To set the space between tiles, enter a value in points in the Grout edit box.
Preserving Your Rough Arrangement
If you check the Preserve Arrangement checkbox, Igor tries to keep the tiled objects in the same approximate positions as your rough pre-positioning. See Layout Tiling Guided Tour for an example.
If your approximate positioning is not close enough and if you have left the number of rows and columns as Auto, Preserve Arrangement may get the wrong row/column arrangement. In this case, enter specific values for the number of rows and columns and try again.
Other Tiling Issues
Regardless of the parameters you specify, Igor clips coordinates so that a tiled object is never completely off the page. Also, objects are never set smaller than a minimum size or larger than the page.
If Preserve Arrangement is unchecked, objects are tiled from left to right, top to bottom. If you select objects in the Objects to Arrange list, they are tiled in the order in which you selected them. If you select no objects in the list, the order in which objects are tiled is determined by the front to back ordering of the objects in the layout.
Aligning Layout Objects
It is a common practice to stack a group of graphs vertically in a column. Sometimes, only one X axis is used for a number of vertically stacked graph. Here is an example.

This section gives step-by-step instructions for creating a layout like the one above. It is also possible to do this using a single graph (see Creating Stacked Plots for details) or using subwindows (see Embedding and Subwindows).
To align the axes of multiple graph objects in a layout, it is critical to set the graph margins. This is explained in detail as follows.
The basic steps are:
-
Prepare the graphs.
-
Append the graph objects to the layout.
-
Align the left edges of the graph objects.
-
Set the width and height of the graph objects.
-
Set the vertical positions of the graph objects.
-
Set the graph plot areas and margins to uniform values.
It is possible to do steps 3, 4, and 5 at once by using the Arrange Objects dialog. However, in this section, we will do them one-at-a-time.
Prepare the Graphs
It is helpful to set the size of the graph windows approximately to the size you intend to use in the layout so that what you see in the graph window will resemble what you get in the layout. You can do this manually or you can use the MoveWindow operation. For example, here is a command that sets the target window to 5 inches wide by 2 inches tall, one inch from the top-left corner of the screen.
MoveWindow/I 1, 1, 1 + 5, 1 + 2
In the example shown above, we wanted to hide the X axes of all but the bottom graph. We used the Axis tab of the Modify Graph dialog to set the axis thickness to zero and the Label Options tab to turn the axis labels off.
Append the Graphs to the Layout
Click on the layout window or create a new layout using the New Layout item in the Windows menu. If necessary, activate the layout tools by clicking the layout icon in the top-left corner of the layout. Use the Graph pop-up menu or the Append to Layout item in the Layout menu to add the graph objects to the layout. Drag each graph object to the general area of the layout page where you want it.
Align the Left Edges of the Layout Objects
Drag one of the graphs to set its left position to the desired location. Then Shift-click the other graphs to select them. Now choose Align→Left Edges from the Layout menu.
Set the Width and Height of the Layout Objects
Set the width and height of one of the graph objects by selecting it and dragging the resulting handles or by double-clicking it and entering values in the Modify Objects dialog.
Click in a blank part of the page to deselect all objects. Now click the object whose dimensions you just set. Now Shift-click to select the other graph objects. With all of the graph objects selected, choose Make Same Width And Height from the Layout menu.
Set the Vertical Positions of the Layout Objects
Drag the graph objects to their approximate desired positions on the page. You can drag an object vertically without affecting its horizontal position by pressing Shift while dragging. You must press Shift after clicking the object - otherwise the Shift-click will deselect it. Once you have set the approximate position, fine tune the vertical positions using the arrow keys to nudge the selected object.
Set Graph Plot Areas and Margins
At this point, your axes would be aligned except for one subtle thing. The width of text (e.g., tick mark labels) in the left margin of each graph can be different for each graph. For example, if one graph has left axis tick mark labels in the range of 0.0 to 1.0 and another graph has labels in the range 10,000 to 20,000, Igor would leave more room in the left margin of the second graph. The solution to this problem is to set the graph margins, as well as the width of the plot areas, of each graph to the same specific value.
To do this, select all of the graph objects and then choose Make Plot Areas Uniform from the Layout menu. This invokes the following dialog:
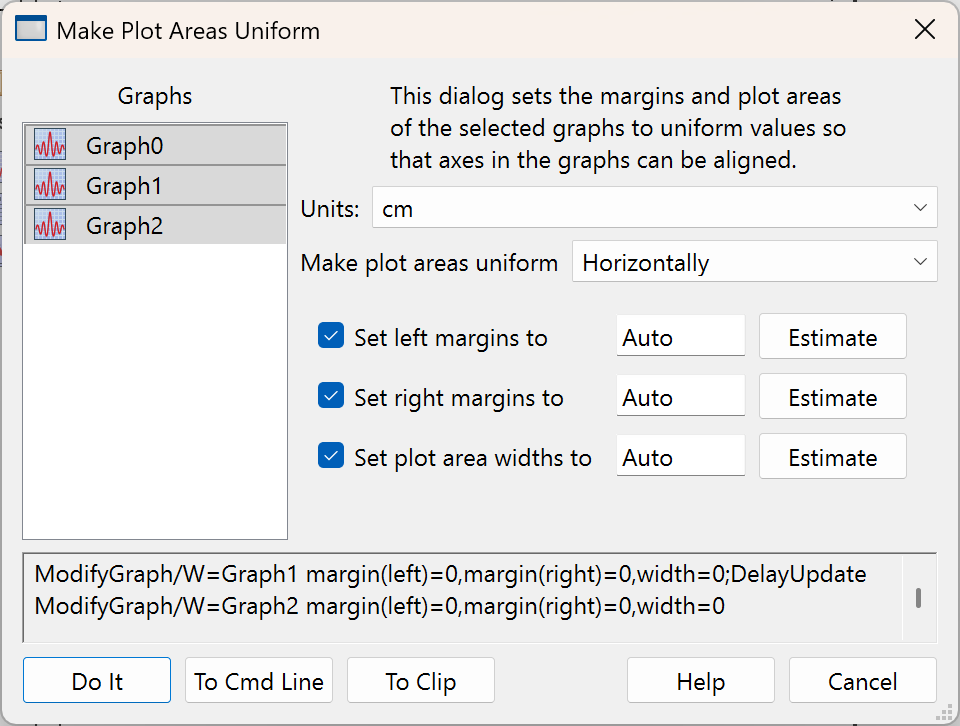
Because we are stacking graphs vertically, we want their horizontal margins and plot areas to be the same, which is why we have selected Horizontally from the pop-up menu. The three checkboxes are selected because we want to set both the left and right margins as well as the plot area width.
Now click each of the three Estimate buttons. When you click the Estimate button next to the Set Left Margins To checkbox, Igor sets the corresponding edit box to the largest left margin of all of the graphs selected in the list. Igor does a similar thing for the other two Estimate buttons. As a result, after clicking the three buttons, you should have reasonable values. Click Do It.
Now examine the stacked graph objects. It is possible that you may want to go back into the Make Plot Areas Uniform dialog to manually tweak one or more of the settings.
After doing these steps, the horizontal plot areas in the stacked graphs will be perfectly aligned. This does not, however, guarantee that the left axes will line up. The reason for this is the graphs' axis standoff settings. The axis standoff setting, if enabled, moves the left axis to the left of the plot area to prevent the displayed traces from colliding with the axis. If the graphs have different sized markers, for example, it will offset the left axis of each graph by a different amount. Thus, although the plot areas are perfectly-aligned horizontally, the left axes are not aligned. The solution for this is to use the Modify Axis dialog (Graph menu) to turn axis standoff off for each graph.
Copying and Pasting Layout Objects
This section discusses copying objects from the layout layer of a page layout and pasting them into the same or another page layout. Most users will not need to do this.
Copying Objects from the Layout Layer
You can copy objects to the clipboard by selecting them with the arrow tool or enclosing them with the marquee tool and then choosing Copy from the Edit menu. You can also choose Copy from the pop-up menu that appears when you click inside the marquee.
When you copy an object to the clipboard, it is copied in two formats:
-
As an Igor object in a format used internally by Igor
-
As a picture that can be understood by other applications
Although you can do a copy for the purposes of exporting to another application, this is not the best way. See Exporting Page Layouts for a discussion of exporting graphics to another application. This section deals with copying objects for the purposes of pasting them in the same or another layout. Since it is easy to append graphs and tables to a layout using the pop-up menus in the tool palette, the main utility of this is for copying annotations or pictures from one layout to another.
Copying as an Igor Object Only
There are times when a straightforward copy operation is not desirable. Imagine that you have some graph objects in a layout and you want to put the same objects in another layout. You could copy the graph objects and paste them into the other layout. However, if the graphs are very complex, it could take a lot of time and memory to copy them to the clipboard as a picture. If your purpose is not to export to another application, there is really no need to copy as a picture. If you press Alt while choosing Copy, then Igor will do the copy only as Igor objects, not as a picture. You can now paste the copied graphs in the other layout.
Pasting Objects into the Layout Layer
This section discusses pasting Igor objects that you have copied from the same or a different page layout. For pasting a new picture that you have generated with another application, see Inserting a Picture in the Layout Layer.
To paste layout objects that you have copied to the clipboard from the same Igor experiment, just choose Paste from the Edit menu.
When you copy a graph, table, Gizmo or picture layout object from a layout to the clipboard, it is copied as a picture and as an Igor object in an internal Igor format. The Igor format includes the name by which Igor knows the layout object. If you later paste into a layout, Igor will use this name to determine what object should be added to the layout. It normally does not paste the picture representation of the object. In other words, the Igor format of the object that is copied to the clipboard refers to a graph, table, Gizmo or picture by its name.
In rare cases, you may actually want to paste as a picture, not as an Igor object. You might plan to change the graph but want a representation of it as it is now in the layout. To do this, press Alt while choosing Edit→Paste. This creates a new named picture in the current experiment.
Pasting into a Different Experiment
The reference in the clipboard to Igor objects by name doesn't work across Igor experiments. The second experiment may have a different object with the same name or it may have no object with the name stored in the clipboard. The best you can do when pasting from one experiment to another is to paste a picture of the object from the first experiment.
You can force Igor to paste the picture representation instead of the Igor object representation as described above, by pressing Alt while choosing Edit→Paste.
Pasting Color Scale Annotations
For technical reasons, Igor is not able to faithfully paste a color scale annotation that uses a color index wave or that uses the lookup keyword of the ColorScale operation. If you paste such a color scale, Igor will change it to a color table color scale annotation with no lookup.
Page Layout Annotations
The term "annotation" includes textboxes, legends, tags, and color scales. You can create annotations in graphs and in page layouts. Annotations are discussed in detail in Annotations. This section discusses aspects of annotations that are unique to page layouts.
Annotations in page layouts exist as layout objects in the layout layer, along with graphs, tables, 3D Gizmo plots, and pictures.
In a graph, an annotation can be a textbox, legend, tag, or color scale. A legend shows the plot symbols for the waves in the graph. A tag is connected to a particular point of a particular wave. In a layout, tags are not applicable. You can create textboxes, legends, and color scales.
Annotations are distinct from the simple text elements that you can create in the drawing layers of graphs, layouts and control panels.
Creating a New Annotation
To create a new annotation, choose Add Annotation from the Layout menu or select the annotation tool and click anywhere on the page, except on an existing annotation. These actions invoke the Add Annotations dialog.
The many options in this dialog are explained in Annotations.
Modifying an Existing Annotation
If an annotation is selected when you pull down the Layout menu, you will see a Modify Annotation item instead of the Add Annotation item. Use this to modify the text or style of the selected annotation. You can also invoke the Modify Annotation dialog by clicking the annotation while the annotation tool is selected. Double-clicking an annotation while the arrow tool is selected brings up the Modify Object dialog, not the Modify Annotation dialog.
Positioning an Annotation
An annotation is positioned relative to an anchor point on the edge of the printable part of the page. The distance from the anchor point to the textbox is determined by the X and Y offsets expressed in percent of the width and height of the page inside the margins. The X and Y offsets are automatically set for you when you drag a textbox around the page. You can also set them using the Position tab of the Modify Annotation dialog but this is usually not as easy as just dragging.
Positioning Annotations Programmatically
This diagram shows the anchor points:
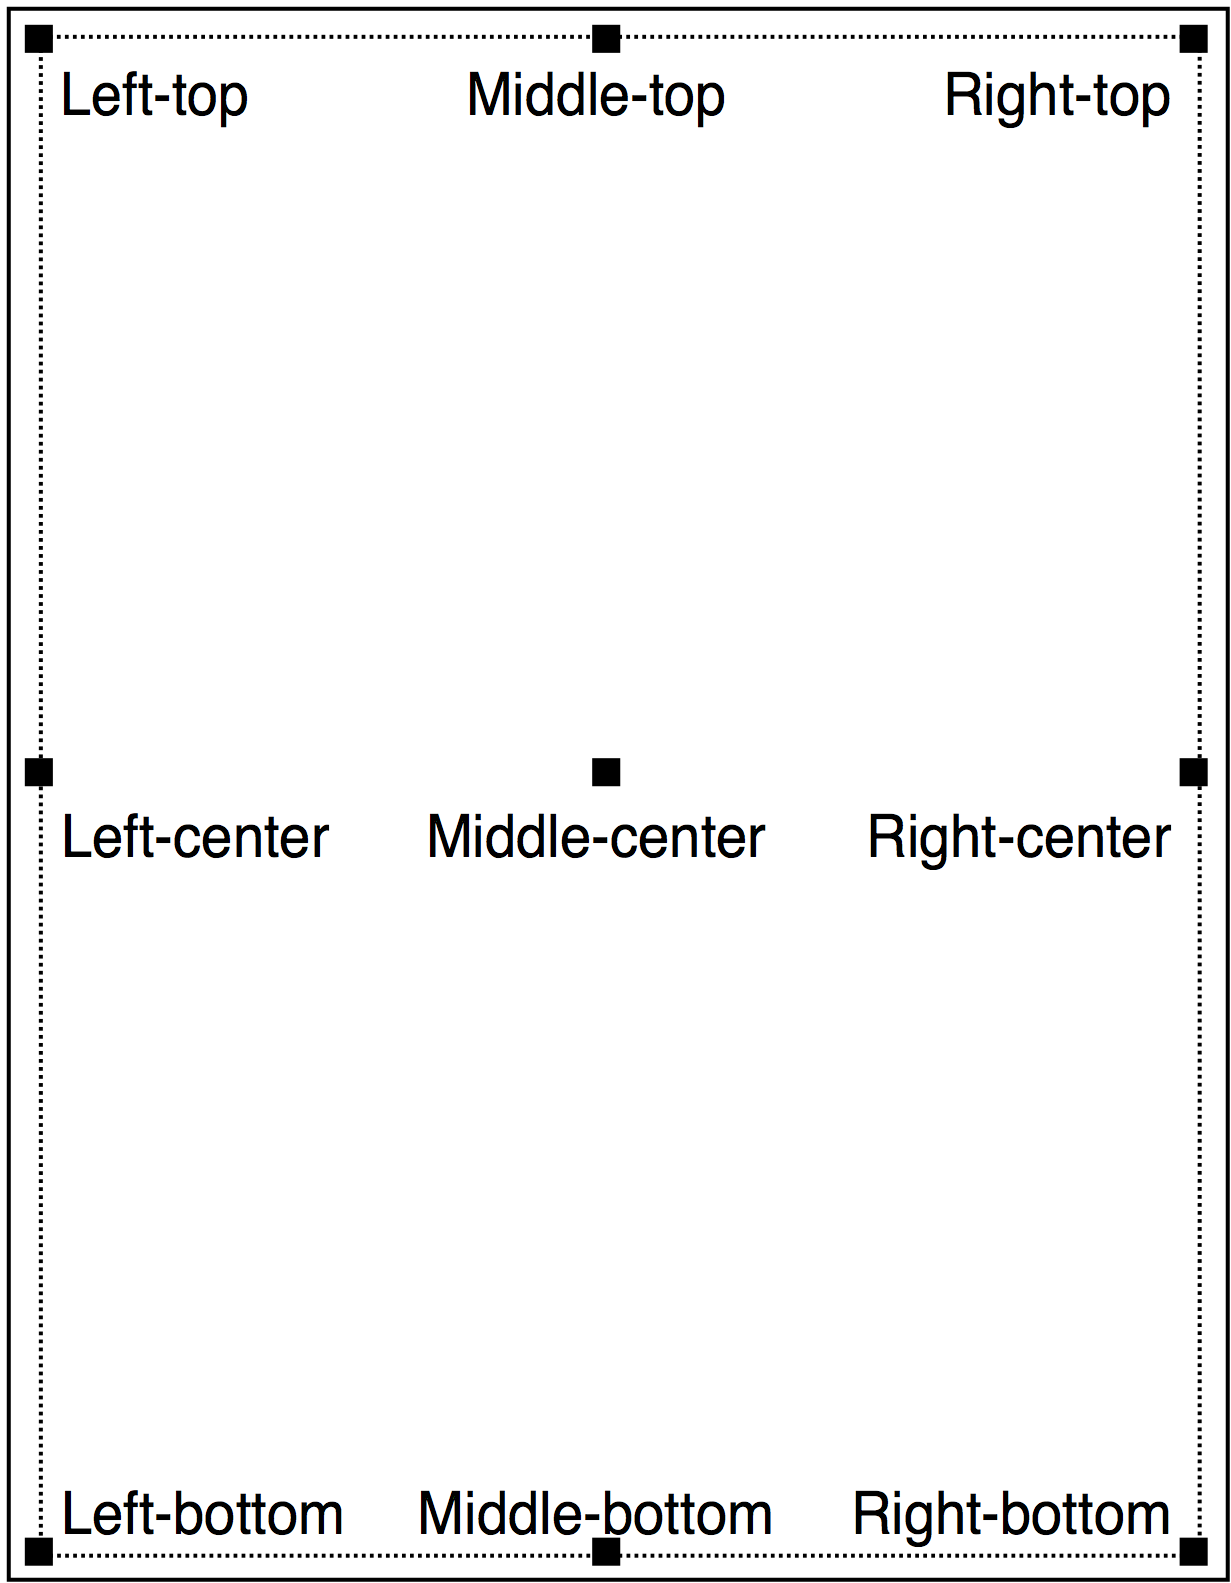
Using the top-left anchor, an XY offset of (0, 0) would put a tag in the top-left corner of the page:
Textbox/A=LT/X=0/Y=0 "Test 1"
An XY offset of (50, 50) would put a tag in the middle of the page.
Textbox/A=LT/X=50/Y=50 "Test 2"
Using the middle-center anchor, an XY offset of (0, 0) would put a tag in the middle of the page:
Textbox/A=MC/X=0/Y=0 "Test 3"
An XY offset of (-50, 50) would put a tag in the top-left corner of the page.
Textbox/A=MC/X=-50/Y=50 "Test 4"
For most purposes, the left-top anchor is the easiest to use and is sufficient.
The anchor sets not only the reference point on the page but also the reference point on the annotation. For example, if the anchor is right-top then the XY offset sets the position of the right-top corner of the annotation, relative to the right-top corner of the page. For this reason, if you want several textboxes to be right-aligned, you would want to use a right-top, right-center or right-bottom anchor.
Legends in the Layout Layer
When you invoke the Add Annotations dialog and choose Legend, Igor automatically sets the annotation's text to produce a legend containing a symbol for each wave in each graph object in the layout. This diagram illustrates the legend text generated by the dialog:
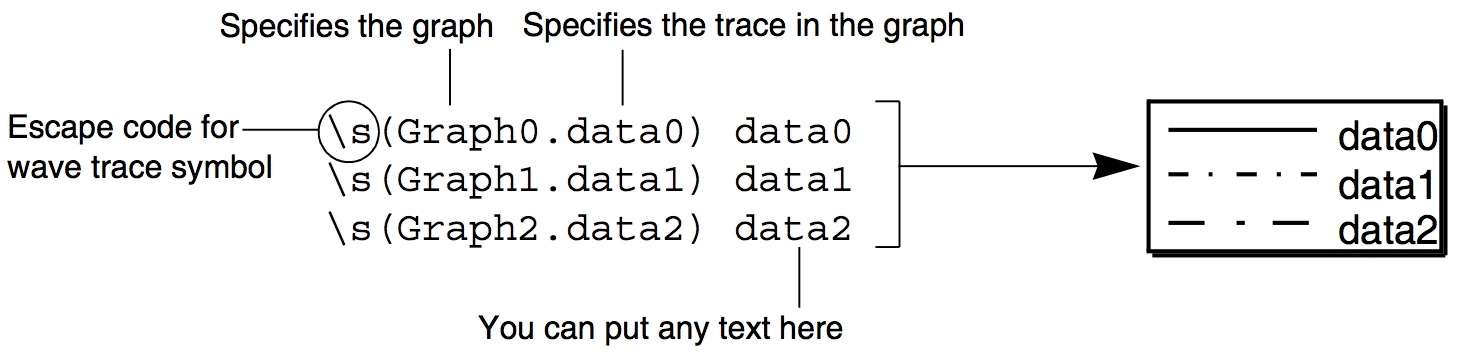
Igor generates the lines of the legend text starting with the bottom graph object in the layout and working toward the top. You can edit the text to remove symbols that you don't want or to change what appears after the symbol.
If you change the symbol for a trace referenced in the legend, Igor automatically updates the layout legend. If you append or remove waves to the graphs represented in the layout, Igor updates the layout legend. Updating happens immediately unless you have turned the layout's DelayUpdate setting on, in which case it happens when you activate the layout.
You can freeze a legend by converting it to a textbox. This stops Igor from automatically updating it when waves are added to or removed from graphs. To do this, select the annotation tool and click in the legend. In the resulting Modify Annotation dialog, change the pop-up menu in the top-left corner from Legend to Textbox. You can also do this using the following command:
Textbox/C/N=text0 // convert legend named text0 into a textbox
Instead of specifying the name of the trace for a legend symbol, you can specify the trace number. For example, "\s(Graph0.#0)" displays the legend for trace number 0 of Graph0.
Default Font
By default, annotations use the default font chosen in the Default Font Dialog via the Misc menu. You can override the default font using the Font pop-up menu in the Add Annotation dialog. If you change the default font, Igor automatically updates the layout.
Page Layout Pictures
You can insert a picture that you have created in another application, for example a drawing program or equation editor, into the layout layer or into a drawing layer. If the picture has some relation to other drawing elements, you should use the drawing layer. If it has some relation to other layout objects, you should use the layout layer. The use of drawing layers is discussed under Pasting a Picture Into a Drawing Layer. This section discusses pictures in the layout layer.
Inserting a Picture in the Layout Layer
All pictures displayed in the layout layer reside in the picture gallery which you can see by choosing Misc→Pictures. If you paste a picture from the clipboard into the layout layer, Igor automatically adds it to the picture gallery. If the picture is in a file on disk, you must first load it into the picture gallery. Then you can place it in the layout layer.
You can insert a picture in the layout layer by copy-and-paste or by loading from a file. When loading from a file you must go through Igor's picture gallery (Misc→Pictures) to load and then place the picture. If you paste a picture from the clipboard, it is automatically added to the picture gallery.
See Pictures for information on supported picture formats.
Resetting a Picture's Size
If you expand or shrink a picture in the layout layer, you can reset it to its default size by pressing Alt and double-clicking it with the arrow tool.
Page Layout Subwindows
The subwindow is a power-user feature. It is described in detail in Embedding and Subwindows and cannot be effectively used without a careful reading of that section. In this section we discuss subwindows as they apply to page layout windows.
You can create three kinds of subwindows in a page layout window: graphs, tables, and 3D Gizmo plots. To add a subwindow to a layout:
-
Activate the layout layer by clicking the layout icon.
-
Select the marquee tool (dashed-line rectangle).
-
Drag out a marquee.
-
Click inside the marquee and choose one of the following:
- New Graph Here
- New Category Plot Here
- New Contour Plot Here
- New Image Plot Here
- New Table Here
- New 3D Plot Here
You can also create a subwindow by right-clicking while in drawing mode and choosing an item from the New submenu.
You can convert a layout object to an embedded subwindow by right-clicking while in layout mode and choosing Convert To Embedded. Note that a graph containing a control panel or controls cannot be converted into an embedded graph, even though a graph object with controls or control panels can be added to a layout. Such a graph object does not display the controls or control panels, however.
You can convert a subwindow to a standalone window and layout object by right-clicking while in layout mode and choosing Convert To Window And Object. In a graph window, you must click in the graph background, away from any traces or axes.
Page Layout Drawing
Like graphs and control panels, you can add drawing elements to page layouts. Drawing in general is discussed in detail under Drawing. This section discusses drawing issues specific to page layouts.
You enter drawing mode by clicking the second icon from the top in the tool palette, as explained under Activating the Current Drawing Layer. Once in drawing mode, you can select a specific drawing layer using the drawing layer tool, as explained under Changing the Current Drawing Layer.
Page Layout Slide Shows
A layout slide show is a full-screen display of the pages in a layout, suitable for a presentation to a group. You start a slide shows by clicking the button at the bottom/right corner of the layout page sorter, or using the LayoutSlideShow operation.
Using the Slide Show Settings dialog, which you can invoke via the Layout menu, you can control various aspects of the slide show, including:
-
How pages are scaled to fit the screen
-
How multiple monitors are used
-
The time to wait before showing the next slide
Exporting Page Layouts
You can export a layout to another application through the clipboard or by creating a file. To export via the clipboard, use the Export Graphics item in the Edit menu. To export via a file, use the Save Graphics item in the File menu.
If you want to export a section of the page, use the marquee tool to specify the section first. To do this, the layout icon in the top-left corner of the layout window must be selected.
If you don't use the marquee, Igor exports the entire page, or the part of the page that has layout objects or drawing elements in it. The Crop to Page Contents, in the Export Graphics and Save Graphics dialogs, controls this.
The process of exporting graphics from a layout is very similar to exporting graphics from a graph. You can find the details under Exporting Graphics (Windows). This section describes the various export methods and how to select the method that will give you the best results.
Page Layout Preferences
Page layout preferences allow you to control what happens when you create a new layout or add new objects to the layout layer of an existing layout. To set preferences, create a layout and set it up to your taste. We call this your prototype layout. Then choose Capture Layout Prefs from the Layout menu.
Preferences are normally in effect only for manual operations, not for programmed operations in Igor procedures. This is discussed in more detail in Preferences.
When you initially install Igor, all preferences are set to the factory defaults. The dialog indicates which preferences you have changed.
The "Window Position and Size" preference affects the creation of new layouts only.
The Object Properties preference affects the creation of new objects in the layout layer. To capture this, add an object to the layout layer and use the Modify Objects dialog to set its properties. Then select the object and choose Capture Layout Prefs. Select the Object Properties checkbox and click Capture Prefs.
The page size and margins preference affects what happens when you create a new layout, not when you recreate a layout using a recreation macro.
Page Layout Style Macros
The purpose of a layout style macro is to allow you to create a number of layouts with the same stylistic properties. Using the Window Control dialog, you can instruct Igor to automatically generate a style macro from a prototype layout. You can then apply the macro to other layouts.
Igor can generate style macros for graphs, tables and page layouts. However, their usefulness is mainly for graphs. See Graph Style Macros. The principles explained there apply to layout style macros also.