Embedding and Subwindows
You can embed graphs, tables, Gizmo plots, and control panels into other graphs and control panels.
You can embed graphs, tables, and Gizmo plots into page layouts.
Finally, you can embed notebooks in control panels only.
The embedded window is called a "subwindow" and the enclosing window is called the "host". Subwindows can be nested in a hierarchy of arbitrary depth. The top host window in the hierarchy is known as the "base".
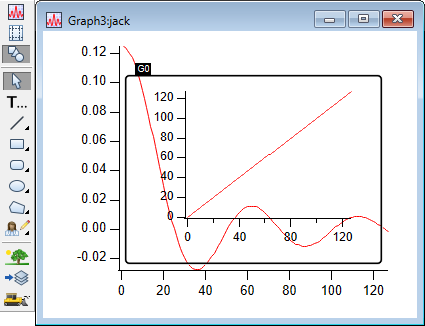
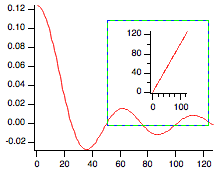
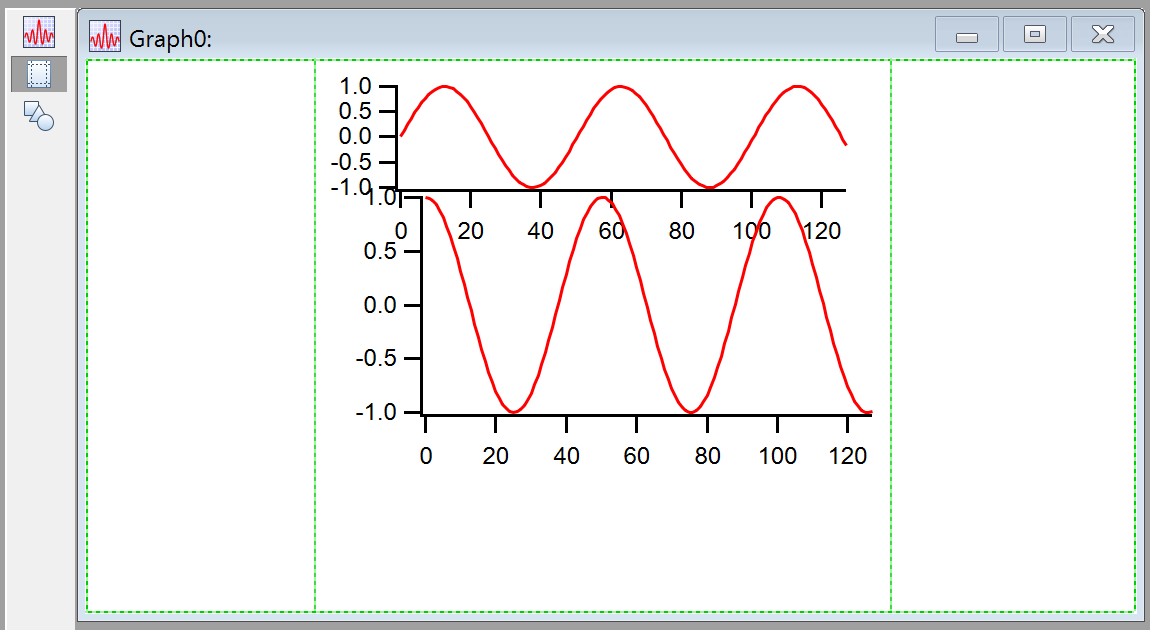
In this example, the inset graph is a subwindow:
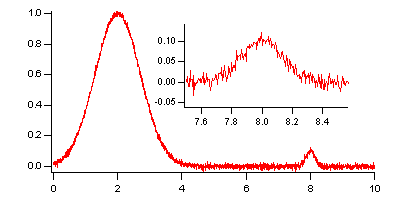
Although you can create graphs like this by careful positioning of free axes, it is much easier to accomplish using embedding.
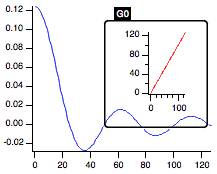
In the next example, the two graphs are subwindows embedded in a host panel:
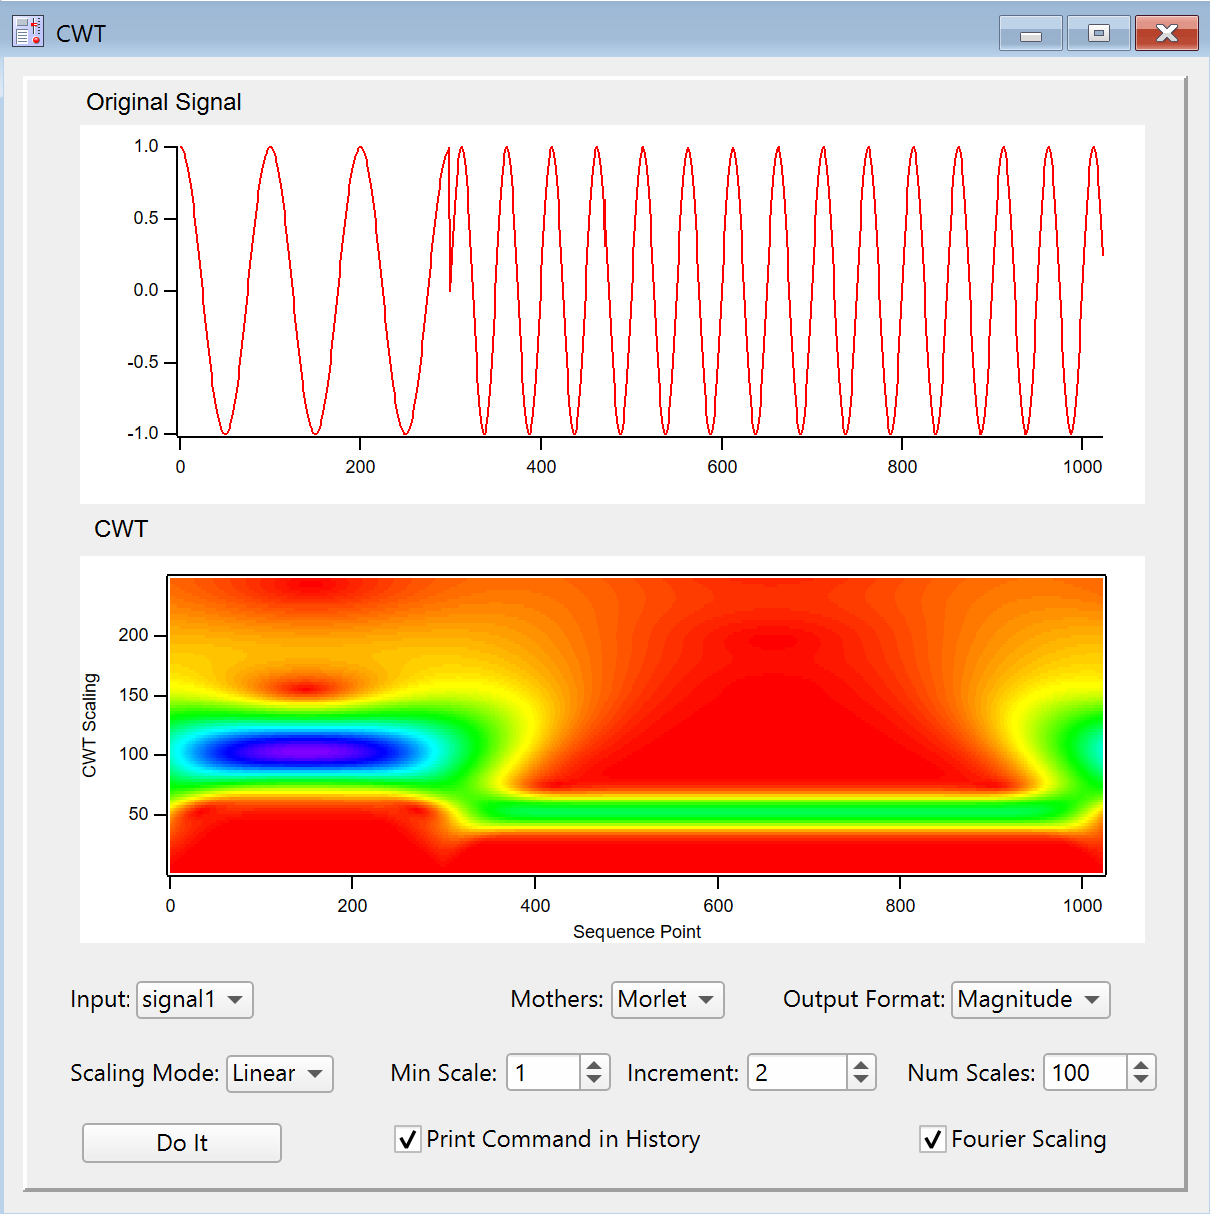
This example is derived from the CWT demo experiment which you can find in the Analysis section of your Examples folder.
Subwindow Terminology
When a window is inserted into another window it is said to be "embedded". In some configurations (see Subwindow Restrictions), an embedded window does not support the same functionality that it has as a standalone window. It is then called "presentation-only" object. For example, when a table is embedded in a panel, it has scroll bars and data entry features just like a standalone table. But when a table is embedded in a graph or in a page layout, it is a presentation-only object with no scroll bars or user interface elements.
A graph, layout, or control panel window operates in one of three modes:
-
Operate mode (also called normal mode)
-
Guides mode
-
Draw mode
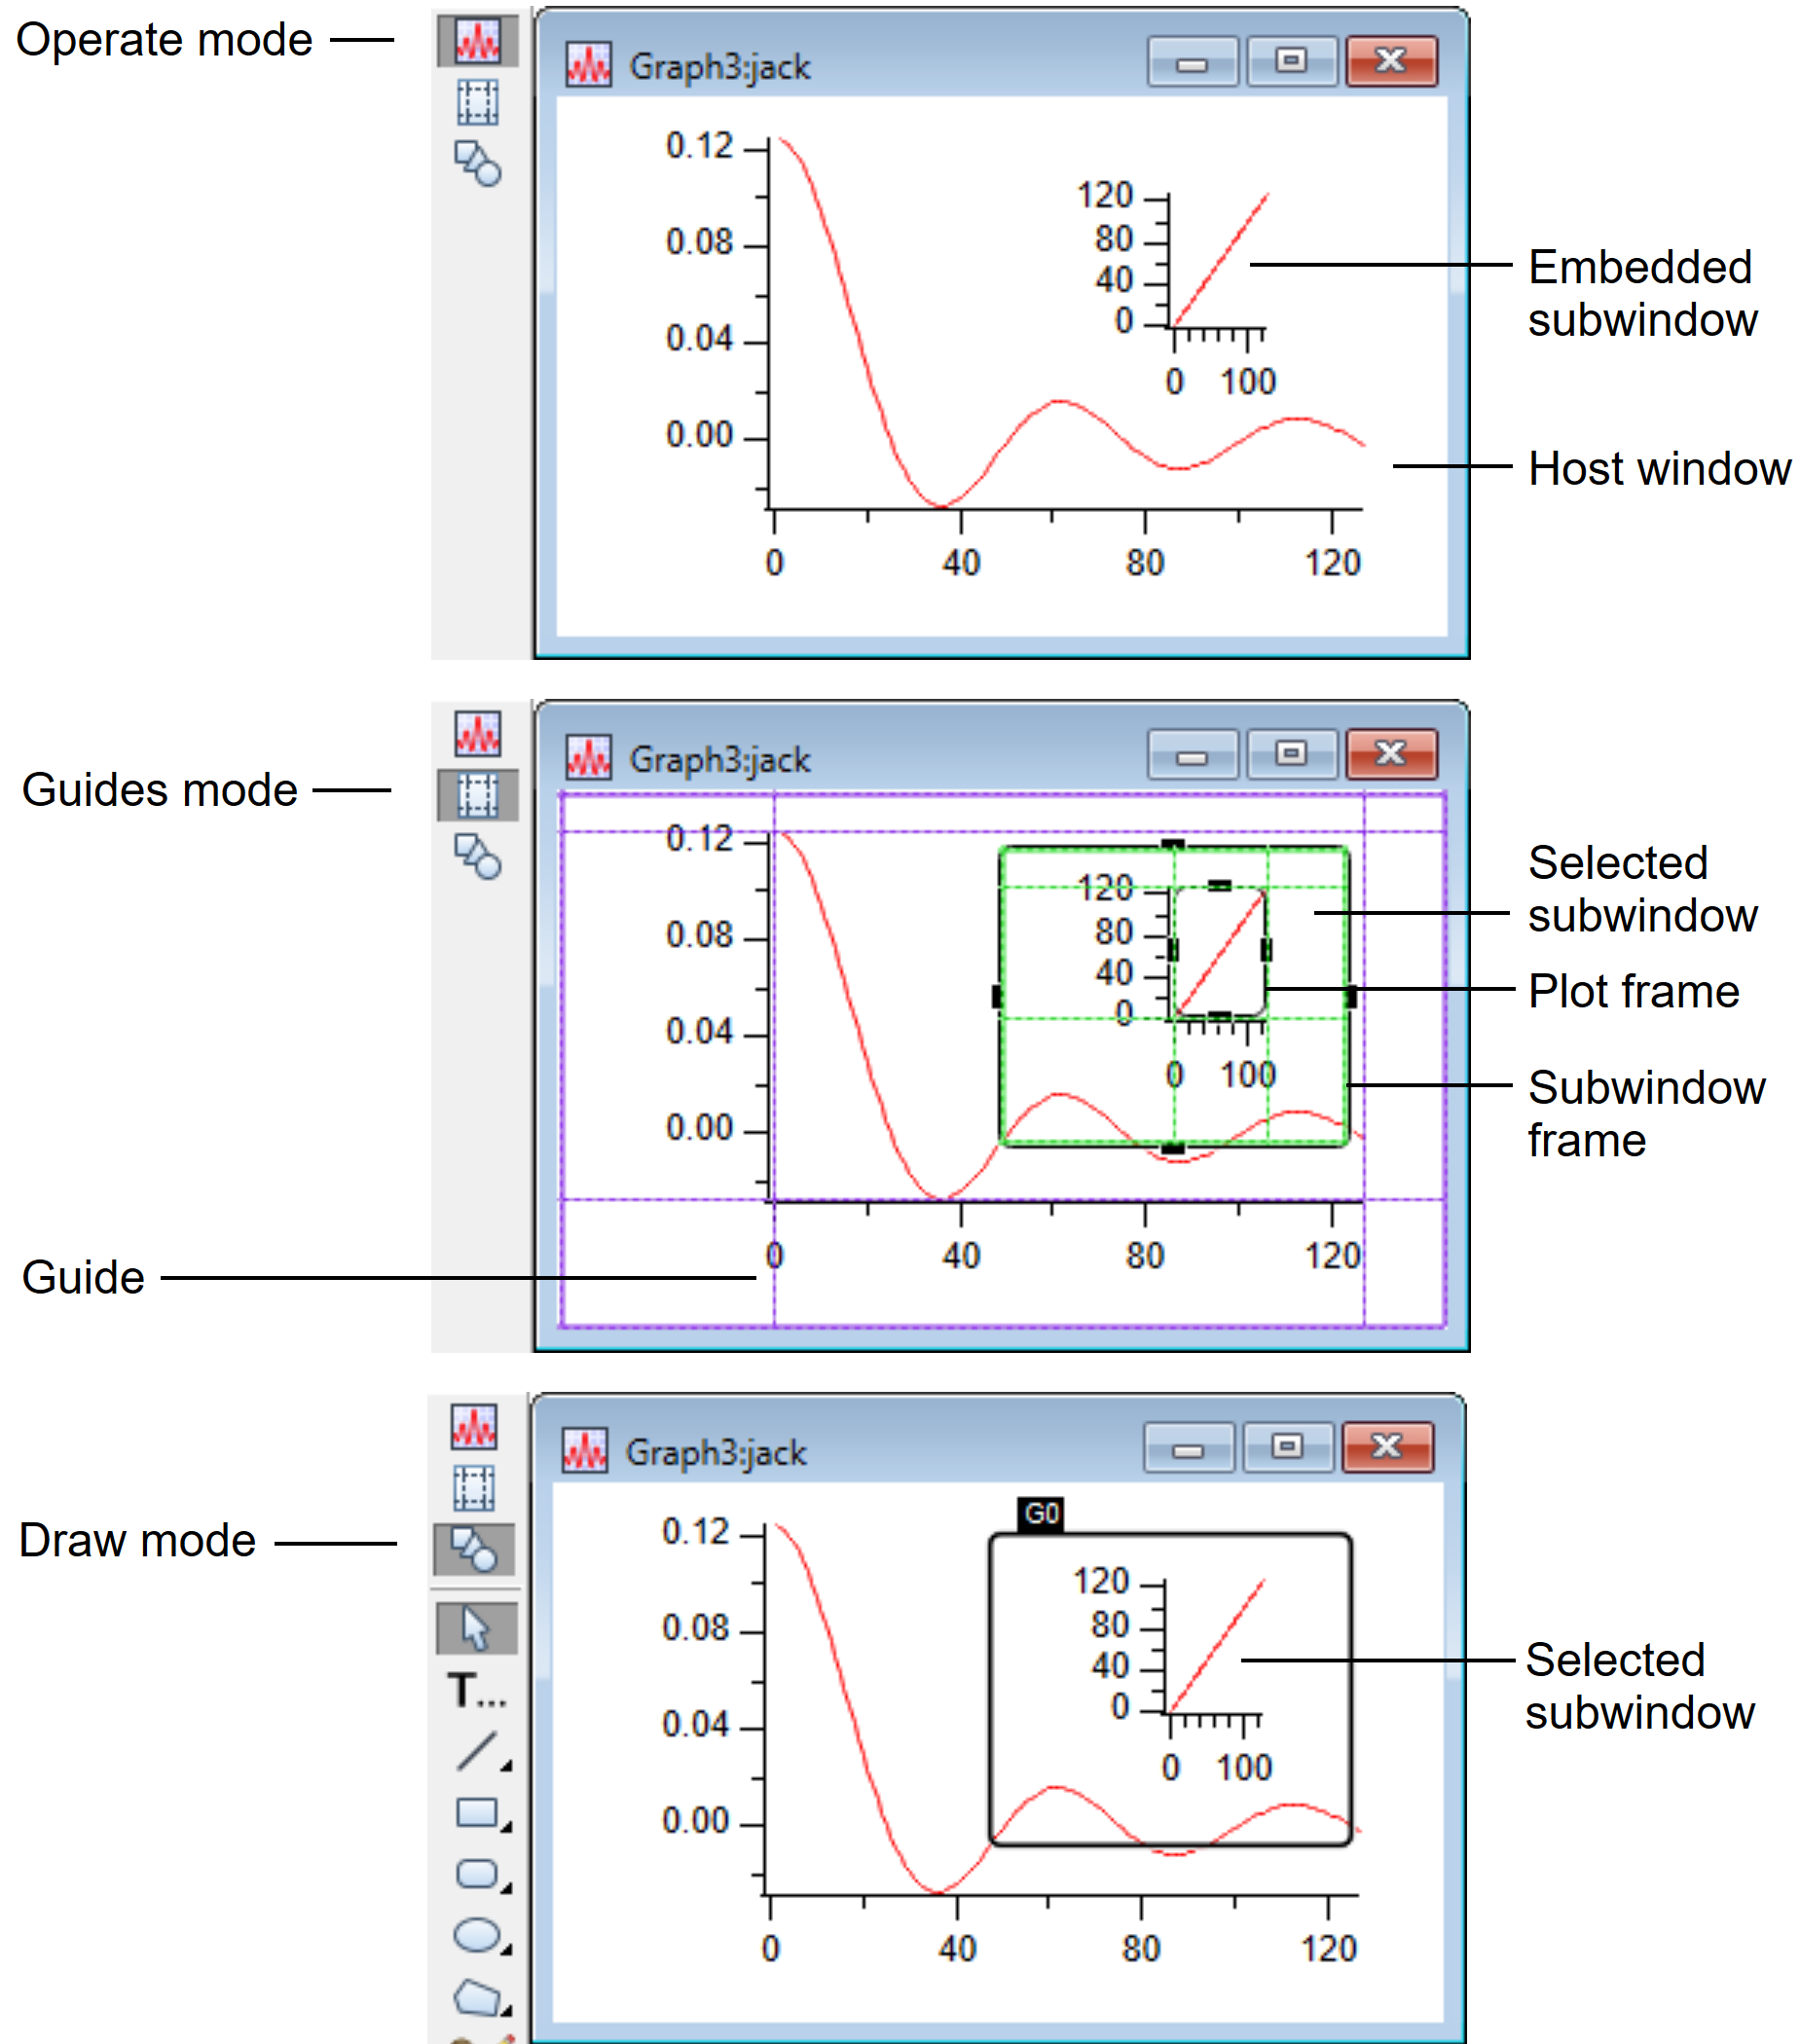
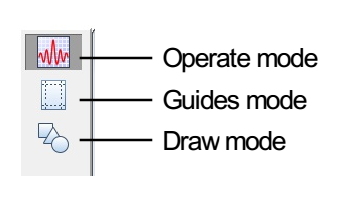
The three modes are accessible from the top three buttons in the tool palette. Open the tool palette from Graph > Show Tools, pressing CTRL+T, or by right-clicking inside a window.
The top icon in the tool palette is Operate mode. This is the mode in which the user normally uses the window or active subwindow.
The second icon in the tool palette is Guides mode. In this mode you can position and resize subwindows, as well as create and adjust guides.
The third icon in the tool palette is Draw mode. In this mode, you can use drawing tools on the window or active subwindow.
Subwindow Restrictions
The following table summarizes the rules for allowed host and embedded window configurations:
| Sub\Host | Graph | Table | Panel | Layout |
|---|---|---|---|---|
| Graph | Yes | No | Yes | Yes |
| Table | Yes* | No | Yes | Yes * |
| Panel | Yes** | No | Yes | No |
| Layout | No | No | No | No |
| Notebook | No | No | Yes | No |
| Gizmo | Yes | No | Yes | No |
* Tables embedded in graphs or layouts are presentation-only objects. They do not support editing of data.
** Panels can be embedded in base graphs only.
Creating Subwindows
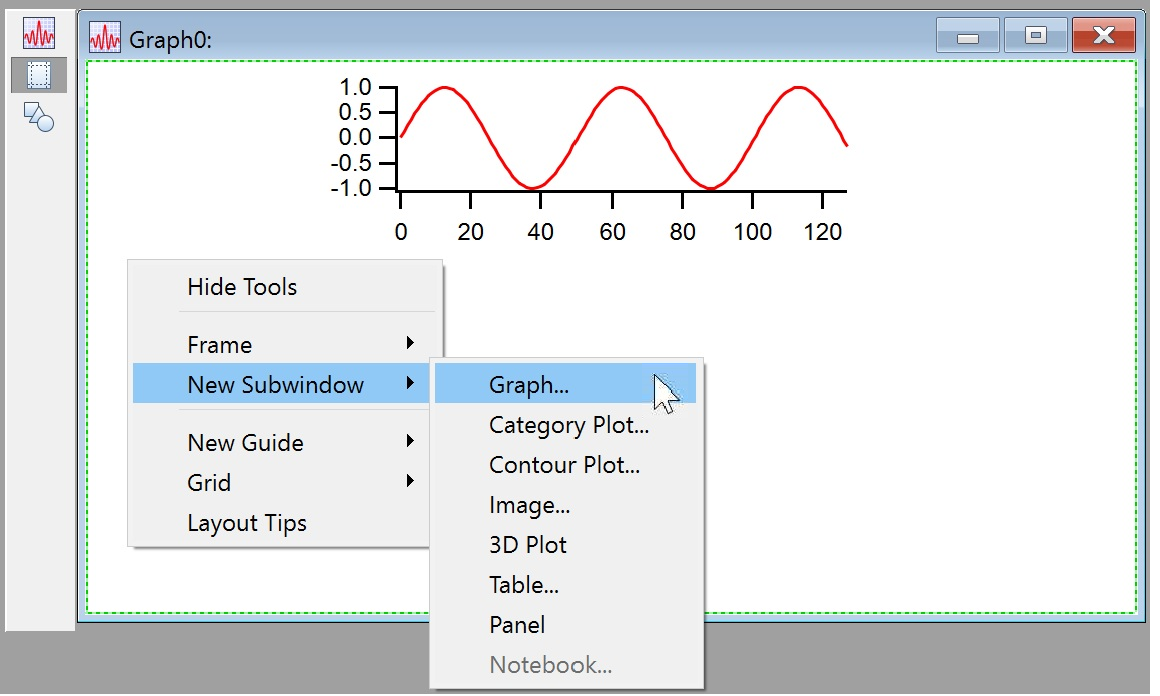
You can create subwindows either from the command line (see Subwindow Command Concepts) or interactively using contextual menus. To add a subwindow interactively press CTRL+T to show the tool palette of the base window, click the third icon to enter draw mode, right-click in the interior of the window, and then choose the desired type of subwindow from the New Subwindow menu. This right-click menu is also available from guides mode.
Igor presents the normal dialog for creating a new window but the result will be a subwindow.
You can position the subwindow by clicking on guides mode and dragging the (green) selected subwindow frame.
Finally, click the top icon of the tools toolbar to adjust the graph contents and settings in operate mode.
Positioning and Guides
Subwindows can be positioned in their hosts in a wide variety of ways. You can specify the position of a subwindow numerically using either absolute (fixed distance) or relative modes. You can also attach key locations in a subwindow to named guides.
Guides are horizontal or vertical reference locations defined by the immediate host of a subwindow and may be either fixed (built-in) or moveable (user-defined). Built-in guides represent fixed locations of the host such as its frame or the interior plot area of graphs. Built-in guides cannot be moved except by moving the object to which the guide refers.
All host windows have built-in guides named FL, FT, FR and FB for Frame Left, Frame Top, Frame Right and Frame Bottom. Graphs also have the corresponding PL, PR, PT and PB for the interior plot area. In addition, base graphs have built-in guides: GL, GR, GT and GB for the graph area.
| Left | Top | Right | Bottom | |
|---|---|---|---|---|
| Host Window Frame | FL | FT | FR | FB |
| Host Graph Rectangle | GL | GT | GR | GB |
| Inner Graph Plot Rectangle | PL | PT | PR | PB |
The graph area is the total area of the graph window. The frame area is the total area of the graph window excluding the areas occupied by control bars.
User-defined guides can be based on built-in or other user-defined guides. They can be defined as being either a fixed distance from another guide or a relative distance between two guides.
Reference points of a subwindow that can be attached to guides include the outer left, top, right and bottom for all subwindow types and, for graphs only, the interior plot area.
Guides are especially handy when creating stacked graphs. By attaching the plot left (PL) location on each graph to a user-defined guide, all left axes will be lined up and will move in unison when you drag the guide around. This is illustrated below in Guides Mode and Guide Tutorial.
Frames
You can specify a frame style for each subwindow. Frames, if any, are drawn inside the rectangle that defines the location of the subwindow and the normal content is then inset by the frame thickness. Frames can also be specified for base graph and panel windows. This is handy when you want to include a frame when you export or print a graph. You can adjust the frame for a window or subwindow by right-clicking in draw mode.
Subwindow User-Interface Concepts
Each host window has three main modes corresponding to the top three icons in the window's tool palette. Choose Show Tools from the Graph or Panel menu to show the tool palette. Clicking the top icon selects operate mode and clicking the second icon selects "Guides" mode, and clicking the third icon selects draw mode.
Guides mode makes available a system of guide lines that serve as flexible anchors for positioning and sizing subwindows in any window that can host a subwindow, and for positioning and sizing controls in a control panel (see Guides Mode for Laying Out Subwindows and Laying Out Controls in Guides Mode).
When not using subwindows, a particular window is the "target window" — the default window for command-line commands that do not explicitly specify a window. The addition of subwindows leads to the analogous concept of the "active subwindow".
You make a subwindow the active subwindow by clicking it. In operate mode the active subwindow is indicated by a green and blue border. In draw mode it is indicated by a heavy black border with the name of the subwindow shown in the upper left corner, and in guides mode a thin black frame with square handles.
Panel subwindows are exceptions in that clicking them in operate mode does not make them the active subwindow. You must click them while in draw mode or guides mode.
As an example, execute the following:
Make/O jack=sin(x/8)/x,sam=x
Display jack
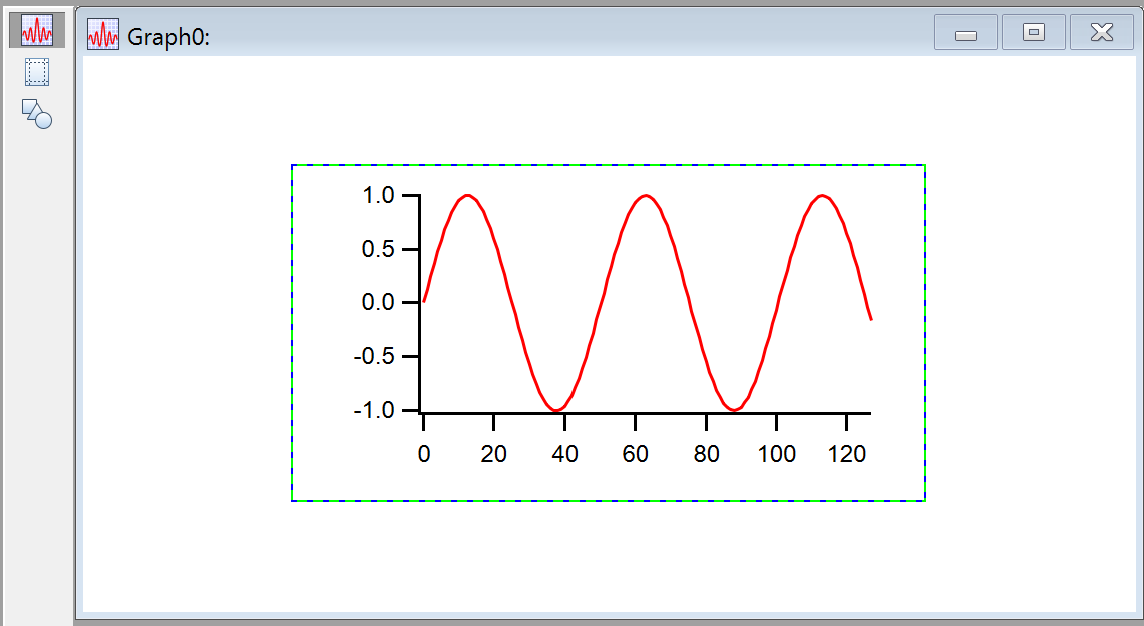
Display/W=(0.5,0.14,0.9,0.7)/HOST=# sam
Notice the green and blue border around the newly created subwindow:
This indicates that it is the active subwindow. Now double-click on the curve in the host window, outside the subwindow border. Change the color of the trace jack to blue and notice that the subwindow is no longer active. Now move the mouse over the subwindow and notice that the cursor changes to the usual shapes corresponding to the parts of the graph that it is hovering over. Drag out a selection rectangle in the plot area of the subwindow and notice that the marquee pop-up menu is available for use on the subwindow and that the subwindow has been activated. Depending on your actions in a window, Igor activates subwindows as appropriate and generally you do not have to be aware of which subwindow is active.
Choose Show Tools from the Graph menu and notice that the tools are provided by the main window. Tools and the cursor information panel are hosted by the base window but apply to the active subwindow, if any.
Usually the tool palette comes up in draw mode, but if it is in another mode, click the draw mode icon in the tool palette. That's the third button from the top.
Notice the subwindow, which had been indicated as active using the green and blue border, now has a heavy frame:
You are now in a mode where you can use drawing tools on the subwindow. To draw in the main window, click outside the subwindow to make the host window active.
When in operate mode, the main menu bar includes a menu (e.g., Graph) appropriate for the base window. If a subwindow is of the same type as the base window, you can target it by clicking it to make it the active window and using the same main menu bar menu.
To make changes to a subwindow of a different type, you can use a context click to access a menu appropriate for the subwindow.
In draw mode, the main menu includes a menu appropriate for the active subwindow. For example, if the base window is a graph with a table subwindow, the menu bar shows the Graph menu when in operate mode. When the table subwindow is selected in draw mode, the main menu bar shows the Table menu.
In draw or guides mode, you can right-click to get a pop-up menu from which you can choose frame styles and insert new subwindows or delete the active subwindow. Deleting a subwindow is not undoable.
The cursor panel in a graph targets the active subgraph. You cannot simultaneously view or move cursors in two different subgraphs.
Guides Mode for Laying Out Subwindows
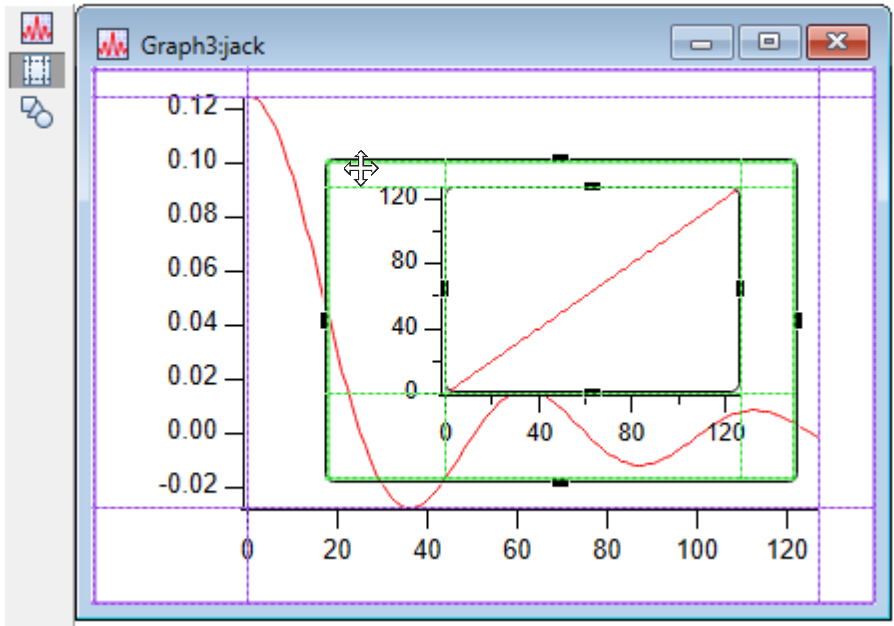
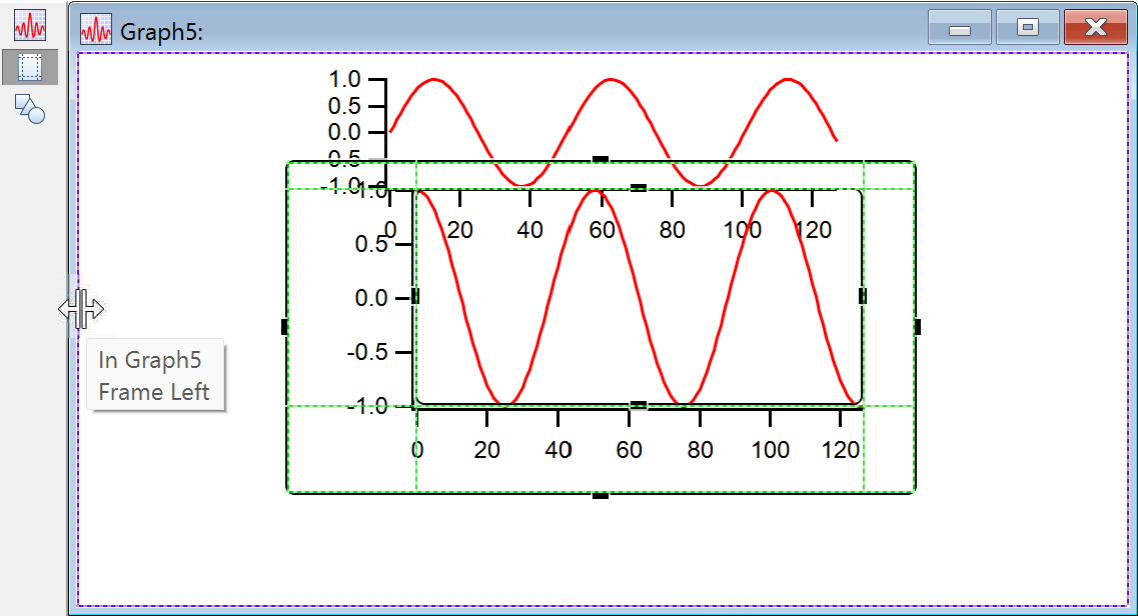
To lay out one or more subwindows in a host window, show the tool palette and click the guides mode icon (the second icon from the top). Click in a subwindow to make it active. In this mode, the subwindow is drawn with a light frame with handles in the middle of each side. In addition, built-in and user-defined guides are drawn in the host window as dotted purple lines and in the active subwindow as dotted green lines.
In guides mode, you can move a subwindow by dragging its frame and resize it using the handles. If you drag a handle close to a guide, it will snap in place and attach itself to the guide. However, if one or more handles are attached to guides and you drag the subwindow using the frame, all attachments are deleted.
The guides are also useful for laying out controls- see Laying Out Controls in Guides Mode. Use the green guides inside the active subwindow for laying out controls.
For those already familiar with "subwindow layout" using guides:
Subwindows and guides for laying out subwindows have been a part of Igor Pro for many years. As of Igor Pro version 10, the concept is extended to laying out controls in control panels. Along with that extension some changes were made that will be new to those already familiar with guides for "subwindow layout."
Prior to Igor 10, guides were displayed only when a subwindow was active, and only in the active subwindow's host. Now guides are displayed inside the active window or subwindow even when there is no active subwindow. You can create and manipulate user-defined guides before creating a subwindow.
Terminology has changed a bit — previously we referred to "subwindow layout" and "layout mode." To avoid confusion with Page Layouts, we now refer to "guides mode" to mean using guides to lay out subwindows.
To make guides mode easier to find, it has been elevated and now has its own button in the tool palette. That means the old method of clicking a subwindow to activate it (shown by the heavy black frame) then clicking very carefully on the frame to enter guides mode and display the resizing handles has been replaced. Now you simply click the guides mode button.
The visual appearance of the guides has changed in a way that we like to think has greater aesthetic appeal :)
A graph subwindow is drawn using two green frames. The innermost green frame represents the plot area of the graph. The plot area frame's handles can be attached to guides to allow easy alignment of multiple graph subwindow plot areas.
The graph's outermost green frame has handles that resize the graph subwindow's entire graph area, which can also be attached to guides.
You can create user-defined guides by pressing Alt and then click-dragging an existing guide such as the host window's outermost (purple) guide. By default, the new guide will be a fixed distance from its parent. If you press the Shift key while dragging, the guide position is constrained to certain fractions of the owning window's width or height.
You can convert the new guide to relative mode, where the guide position is specified as a fraction of the distance between two other guides. You do this by right-clicking on the new guide to display a contextual menu, and then choosing a partner guide from the "make relative to" submenu.
You can also use the contextual menu to convert a relative guide to fixed or to delete a guide, if it is not in use.
Copy and Paste Guides
The contextual menu also allows you to copy and paste guides from one window or subwindow to another. This capability is intended to give you a way to reproduce the guides from one window or subwindow to another; if the window you paste into already has a guide with the same name, the existing guide will be modified. Guides cannot be selected, so the only way to copy is through the contextual menu. Pasting works in the usual way.
The contextual menu appears only for user-defined guides, not for built-in guides.
Guides Mode and Guide Tutorial
In a new experiment, execute these commands:
Make/O jack=sin(x/8),sam=cos(x/8)
Display
Display/HOST=# jack
ShowTools/A
The first Display command created an empty graph and the second inserted a subgraph. The graph is in operate mode and it looks like this:
Click the second icon in the tool palette to enter guides mode, as indicated by the rectangles with handles on each edge of the subgraph, and the appearance of the lines indicating the guides. So far, only the built-in guides are present: green inside the active subwindow and purple in the active subwindow's host, which in this case is the main window:
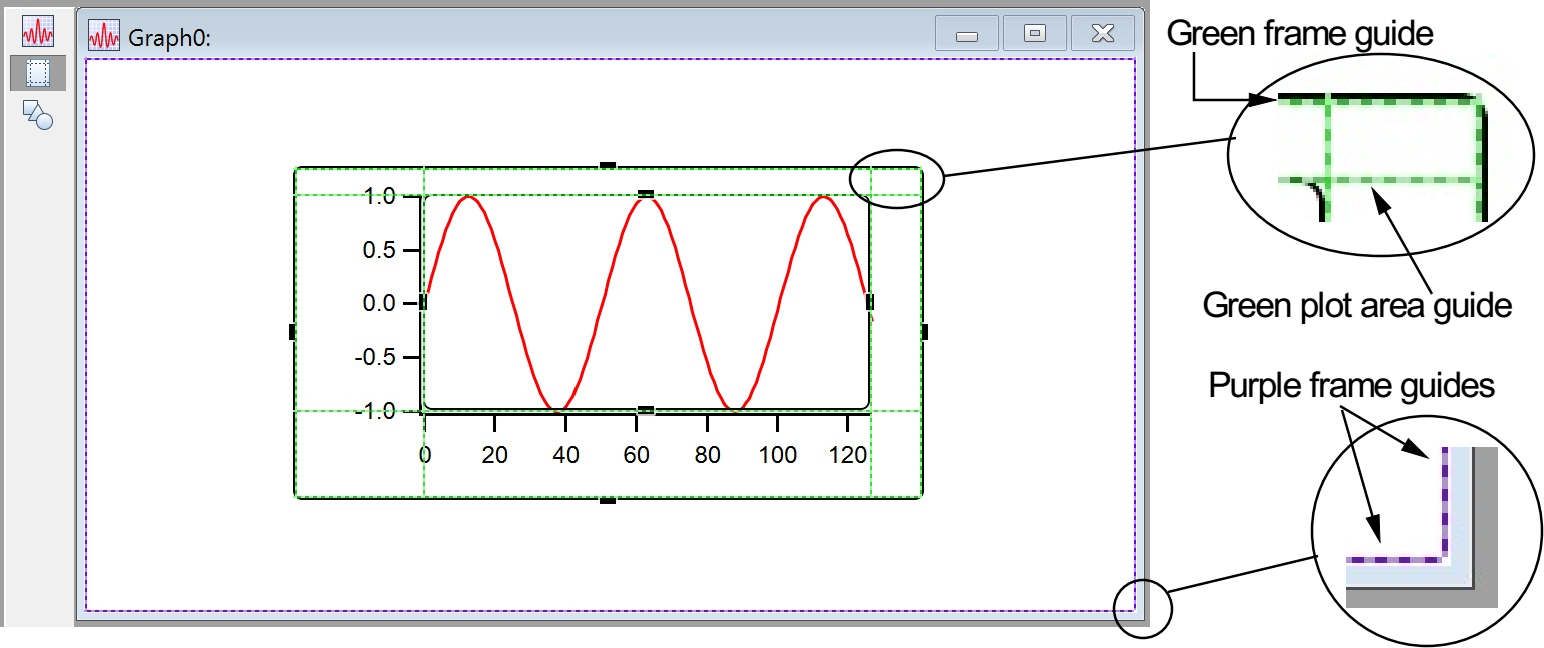
Note the thin purple line just inside the window frame- that shows the built-in guides at the edge of the window, that is, the "frame" guides. The subwindow has green lines just inside the black frame. The frame guides may be hard to see, but they are always there. The subwindow also has plot area guides that can be used to align the axes in the subwindow with features in the host. You can use this feature to make nice-looking stacked graphs.
Position the mouse over the outer subwindow frame until the cursor changes to a 4-headed arrow. Drag the subwindow up as high as it will go and then drag the bottom handle up to just above the halfway point so that the subgraph is in the upper half of the window.
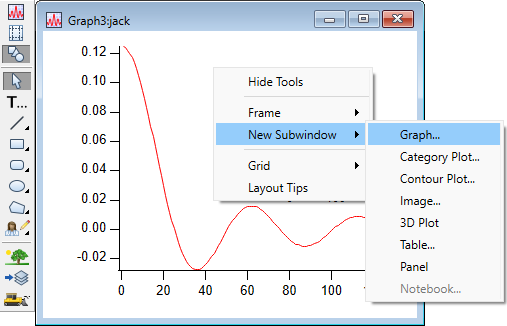
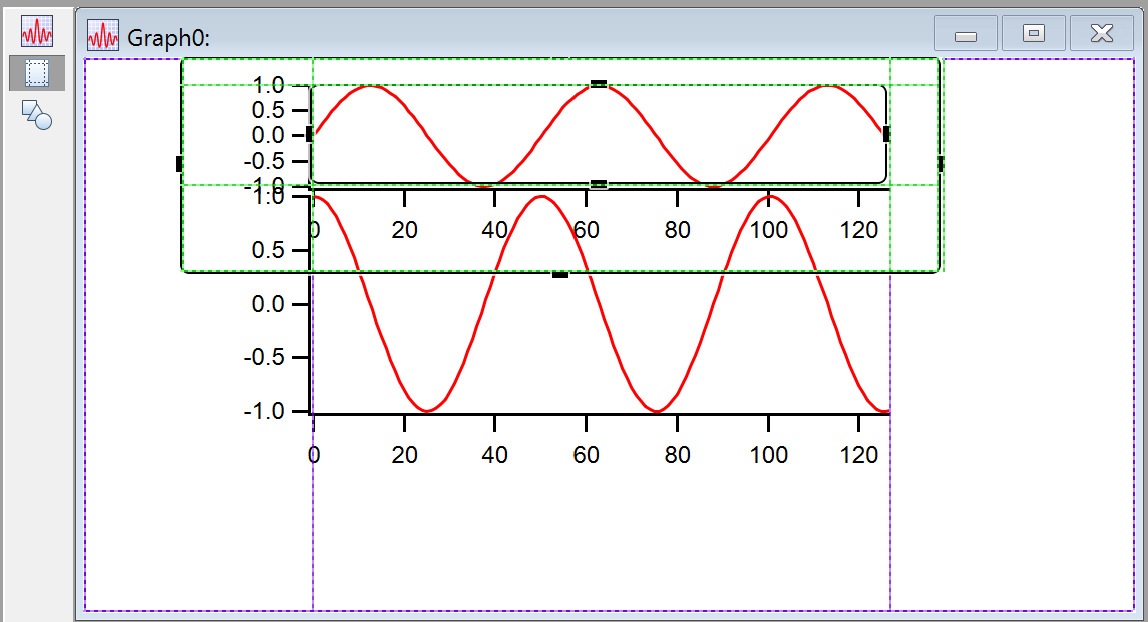
Click outside the subwindow to de-activate the graph subwindow. Right-click below the subgraph and choose New Subwindow->Graph from the pop-up menu:
Pick sam as the Y wave in the resulting dialog and click Do It. This creates a new subwindow and makes it active..
Notice the purple lines around the periphery of the main window (you have to look closely because they are right next to the window frame). These are the fixed frame guides described above; press Alt and move the mouse over the left hand purple line; when you are over a guide, the cursor changes to a two-headed arrow:
If you hover for a bit, you also see a tooltip showing you the name of the guide and the name of the window that owns the guide.
When you see the two-headed arrow, hold Alt while you click and drag to the right about 3 cm to create a user-defined guide. Be sure it's the two-headed arrow with bars as shown in the screen shot above, and not the plain two-headed arrow that is displayed to resize the window.
Use the same technique to create another user-defined guide based on the right edge also inset by about 3 cm. Click in the main window to de-activate the subwindow.
The guide lines in the main window are now green because it is now active.
Move the mouse over the new guides and notice the cursor changes to a two-headed arrow indicating they can be moved. You don't need to hold the Alt or Option key to manipulate a user-defined guide.
Click in the first sub-graph to activate it and then click in the black handle centered on the left axis and drag the handle over the position of the left user guide. Notice that it snaps into place when it is near the guide. Release the mouse button and use the same technique to connect the right edge of the plot area to the right user guide:
Now click in the lower sub-graph to make it active; attach the plot area handles to the guides in the same way. While still in guides mode, drag the user guides around and notice that the two sub-graphs follow and the vertical axes remain aligned with each other. This also shows why the guides in the subwindow are a different color from the guides in the host window: the plot area guides in the subwindow align with the user guide it is attached to; if they were the same color, they would look like one guide.
The two guides we created are a fixed distance from another guide (the frame left (FL) and frame right (FR) in this case). We will now create a relative guide.
Click outside the sub-graphs to activate the main window. Press Alt and move the mouse over the bottom guide line near the window frame. When you notice the cursor changing to a two-headed arrow, click and drag up to about the middle of the graph to create another user-defined guide. At any time, add the Shift key as well; this will cause the position of the guide you are dragging to snap to set fractions of the window's height. For what we are doing here, choose 1/2.
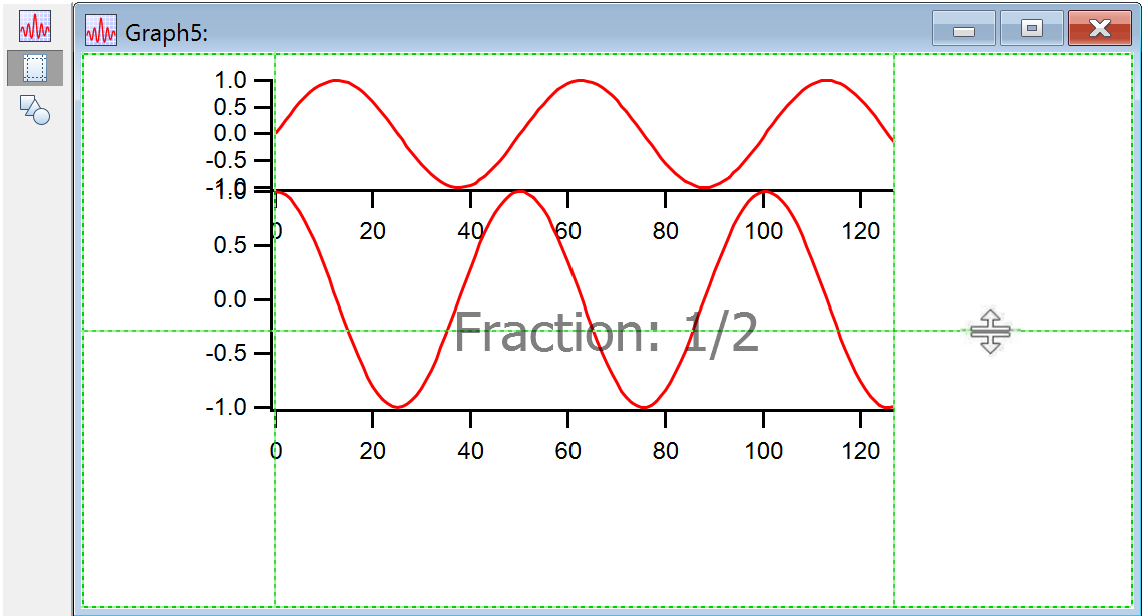
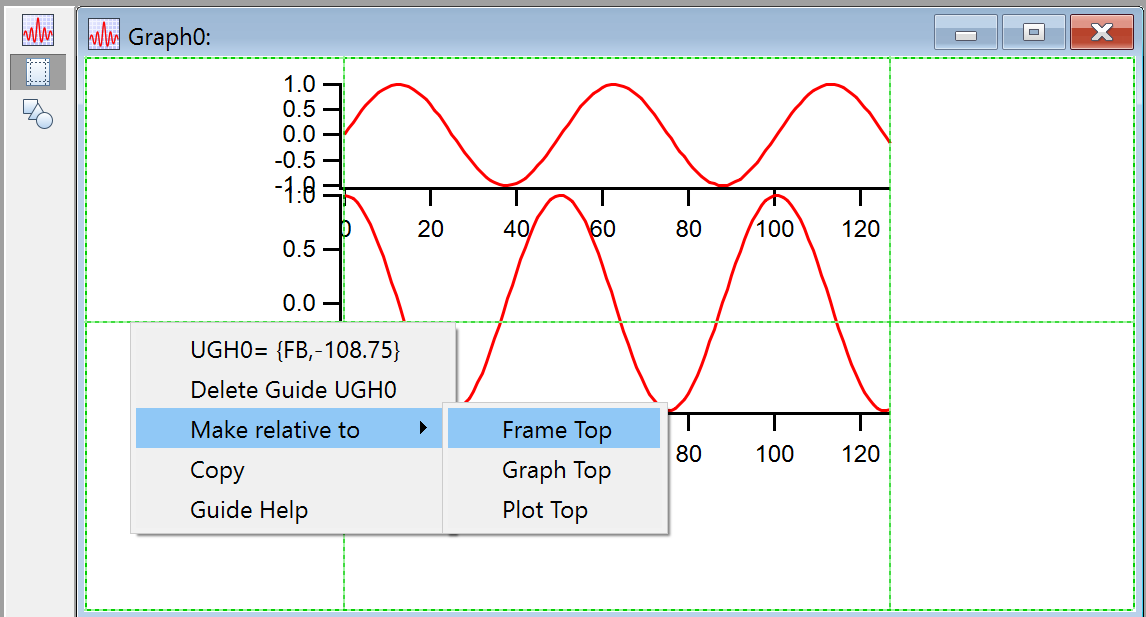
Position the mouse over the new guide, right-click and choose Make Relative to->Frame Top from the pop-up menu:
Now, as you resize the window, the guide remains at the same relative distance between the bottom (FB) and the top (FT).
Activate the top graph and use the handles to attach the bottom of the top graph to the new guide. Attach the top of the graph to the frame top guide. Activate the bottom graph and attach its bottom to the frame bottom and the top to the new user guide:
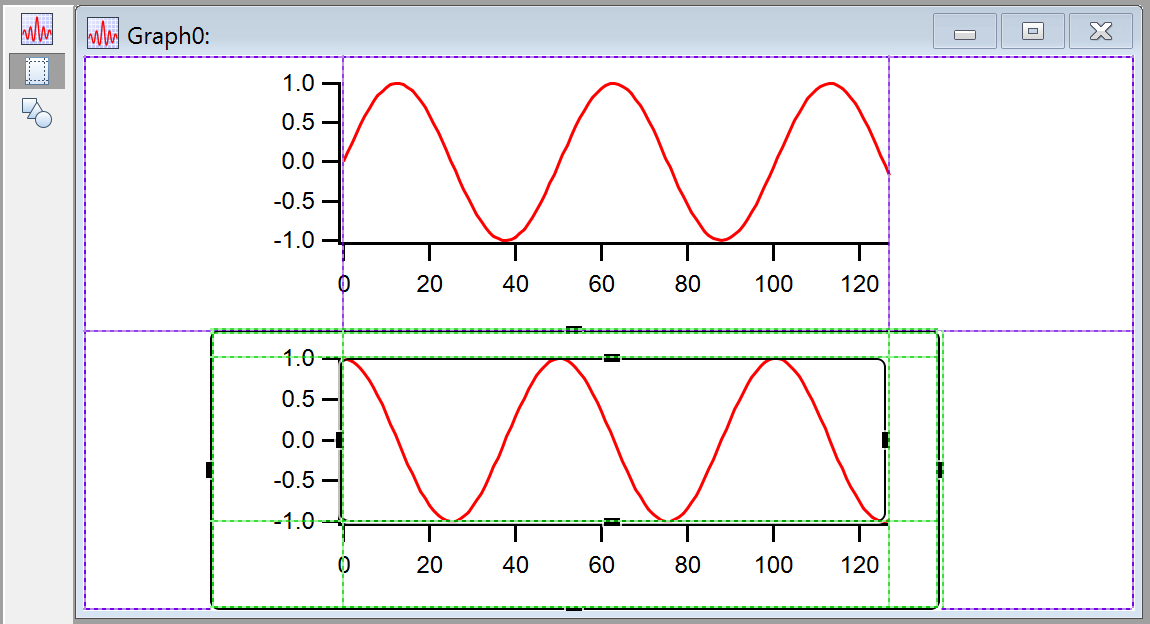
Now when you resize the window, the axes stay aligned with each other, and the two graphs maintain their relative sizes vertically. Since the horizontal guide was positioned at the half-way snap point, the two graphs maintain equal areas in the host window.
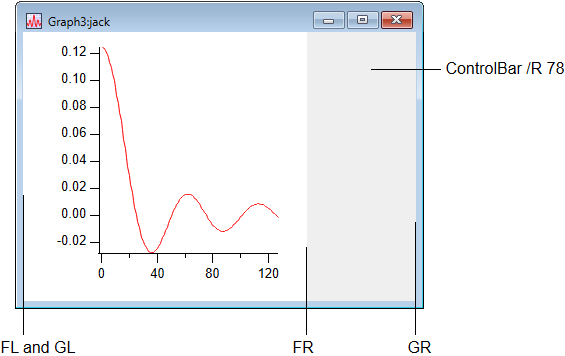
Graph Control Bars and Subpanels
A control bar is a control panel subwindow attached to an edge of a graph.
You can drag out control bar areas from all four sides of a graph window. You do this by entering draw mode, clicking just inside an outer edge of the window, and dragging toward the center of the window. This creates a subpanel and anchors it to appropriate guides.
Subwindows in Page Layouts
Subwindows inside a page layout can be a bit confusing because you use two different modes to position conventional graph and table objects versus subwindows. In the normal mode for a page layout (top icon in the tool palette; operate mode), you can adjust the positioning of conventional layout objects but not subwindows.
In operate mode, subwindow graphs act just like conventional graph windows and allow marquee expansion, double clicking on graph elements to bring up dialogs, dragging textboxes and axes, and other normal graph behavior. But to adjust the position of subwindow graphs, you have to enter guides mode as described above.
Although a bit confusing, the use of subwindows in page layouts is very useful because the page layout is then self-contained and need not refer to other windows.
However, here are a few reasons to use a layout containing only layout objects rather than subwindows:
-
You can use cursors and controls in an appended graph but not in a graph added as a subwindow.
-
You can place the same graph in multiple layouts. Changing the main graph in its graph window will change the appearance of the graph in every layout.
-
You can edit the graph in a larger and more convenient size than the size of the layout object.
Insert a subwindow into a page layout by first specifying the desired location with the marquee tool, then click inside the marquee, and then choosing one of several subwindow types. To change the size or position of the new subwindow, enter guides mode (the third icon in the layout tool palette) and hover over the subwindow to get the desired mouse cursor.
You can convert conventional layout objects to subwindows via the contextual menu for the object. In operate mode (select the top icon in the layout tool palette), right-click anywhere on the layout object and choose Convert graph/table/gizmo to embedded.
Some portions of a graph are not allowed in layouts, such as controls and subpanels. An error will occur if if you try to convert a graph with illegal objects to an embedded subwindow.
You can convert an embedded subwindow to a conventional layout object via the contextual menu for the object. In operate mode, right-click and choose Convert to graph/table/gizmo and object.
In a graph subwindow you must right-click in an area free of traces or axes, such as in the graph margin, to get the correct popup menu. Right-clicking in other areas of a graph will give you popup menus relating to axes or traces, etc.
Notebooks as Subwindows in Control Panels
You can create a notebook subwindow in a control panel using the NewNotebook operation. A notebook subwindow might be used to present status information to the user or to permit the user to enter multi-line text. Here is an example:
NewPanel /W=(150,50,654,684)
NewNotebook /F=1 /N=nb0 /HOST=# /W=(36,36,393,306)
Notebook # text="Hello World!\r"
The notebook subwindow can be plain text (/F=0) or formatted text (/F=1).
By default, the notebook ruler is hidden when a notebook subwindow is created. You can change this using the Notebook operation.
The status bar is never shown in a notebook subwindow and there is no way to show it.
To make it easier to use for text input or display, when a formatted text notebook subwindow is first created, and when you resize the width of the subwindow, Igor automatically adjusts the Normal ruler's right indent so that all of the text governed by the Normal ruler fits in the subwindow. This adjustment is done for the Normal ruler only. Other rulers, including Normal+ (variations of Normal) rulers, are not adjusted.
You can programmatically insert text in the notebook using the Notebook operation.
If you create a window recreation macro for the control panel, by default the contents of the notebook subwindow are saved in the recreation macro. If you later run the macro to recreate the control panel, the notebook subwindow's contents are restored. This also applies to experiment recreation which automatically uses window recreation macros.
If you do not want the contents of the notebook subwindow to be preserved in the recreation macro, you must disable the autosave property, like this:
Notebook Panel0#nb0, autosave=0
When you create a window recreation macro while autosave is on, it will contain commands that look something like this:
Notebook kwTopWin, zdata="GaqDU%ejN7!Z)ts!+J\\.F^>EB"
Notebook kwTopWin, zdata= "jmRiCVsF?/]21,HG<k,\"@i1,&\\.F^>EB"
Notebook kwTopWin, zdataEnd=1
The Notebook zdata command sends to the notebook encoded binary data in an Igor-private format that represents the contents of the notebook when the recreation macro was created. In real life there would be a number of zdata commands, one after the other, which cumulatively define the contents of the notebook. The notebook accumulates all of the zdata text. The zdataEnd command causes the notebook to decode the binary data and use it to restore the notebook's contents.
When you save an experiment containing a control panel, a window recreation macro is created for you by Igor. When you open the experiment, Igor runs the recreation macro to recreate the control panel. If autosave is off, after saving and reopening the experiment, the notebook will be empty. If autosave is on, the window recreation macro will include zdata and zdataEnd commands that restore the contents of the notebook subwindow.
The encoded binary data includes a checksum. If the Notebook zdata commands have been altered, the checksum will fail and you will receive an error when the Notebook zdataEnd command executes.
Open Notebook Subwindow Demo Experiment
Subwindow Command Concepts
All operations that create window types that can be subwindows can take a /HOST=hcSpec flag in order to create a subwindow in a specific host. In addition, operations and functions that can modify or operate on a subwindow can be directed to a specific subwindow using the /W=hcSpec flag for operations, or an hcSpec as a string parameter for functions.
Subwindow Syntax
This table summarizes the command line syntax for identifying a subwindow:
| Subwindow Specification | Location |
|---|---|
| baseName | Base host window |
| baseName#sub1 | Absolute path from base host window |
| #sub1 | Relative path from the active window or subwindow |
| # | Active window or subwindow |
| ## | Host of active subwindow |
The window path uses the # symbol as a separator between a window name and the name of a subwindow. If you have a panel subwindow named P0 inside a graph subwindow named G0 inside a panel named Panel0, the absolute path to the panel subwindow would be Panel0#G0#P0. The relative path from the main panel to the panel subwindow would be #G0#P0.
Subwindow Syntax for Page Layouts
For page layout windows, the standard syntax described above applies to subwindows in the currently active page only. To access a subwindow in any page, whether that page is the active page or not, use a page number in square brackets:
| Subwindow Specification | Location |
|---|---|
| LayoutName | Base host window, active page |
| LayoutName[page] | Base host window, specified page |
| LayoutName#sub1 | Absolute path on active page |
| LayoutName[page]#sub1 | Absolute path on specified page |
Page layout page numbers start at page 1.
This example embeds a graph in page 2 of the layout regardless of what the active page is:
NewLayout
LayoutPageAction appendPage         // Create page 2
LayoutPageAction page=1             // Page 1 is now the current page
Make/O wave0 = sin(x/8)
Display/HOST=Layout0[2] wave0       // Add a graph subwindow to page 2
ModifyGraph/W=Layout0[2]#G0 mode=3  // Set markers mode in graph subwindow
Subwindow Sizing
When /HOST is used in conjunction with Display, NewPanel, NewWaterfall, NewImage, NewGizmo and Edit to create a subwindow, the values used with the window size /W=(a,b,c,d) flag can have one of two different meanings. If all the values are less than 1.0, then the values are taken to be fractional relative to the host's frame. If any of the values are greater than 1.0, then they are taken to be fixed locations measured in points relative to the top left corner of the host.
Guides may override the numeric positioning set by /W. All operations supporting /HOST take the /FG=(gleft,gtop,gright,gbottom ) flag where the parameters are the names of built-in or user-defined guides. FG stands for frame guide and this flag specifies that the outer frame of the subwindow is attached to the guides. A * character in place of a name indicates that the default value should be used.
The inner plot area of a graph subwindow may be attached to guides using the analogous PG flag. Thus a subgraph may need up to three specifications. For example:
Display /HOST=# /W=(0,10,400,200) /FG=(FL,*,FR,*) /PG=(PL,*,PR,*)
When the subwindow position is fully specified using guides, the /W flag is not needed but it is OK to include it anyway.
Subwindow Operations and Functions
Here are the main operations and functions that are useful in dealing with subwindows: