Drawing
Igor's drawing tools are useful in page layout and graph windows for highlighting material with boxes, circles and arrows and can also be used to create simple diagrams. These drawing tools are object-oriented and optimized for the creation of publication quality graphics.
You can graphically edit a wave's data values when it is displayed in a graph; data points can be deleted, added or modified. You can also create new waves by simply drawing them.
In control panel windows, you can use the drawing tools to create a fancy background for controls.
Like all other aspects of Igor, drawing tools are fully programmable. This allows programmers to create packages of code that add new graph types to Igor's repertoire. Although only programmers can create such packages, everyone can make use of them.
The drawing tools are available only in page layout, graph and control panel windows.
The Tool Palette
To use the drawing tools you first need to invoke the tool palette. In graphs and control panels this is done by the Show Tools menu command in the Graph or Panel menu. This command adds a tool palette along the left edge of the window. The tool palette is always available in page layout windows.
With the exception of Undo, Cut, Copy, Clear, Paste, Select All and Duplicate in the Edit menu, all drawing commands are located in the tool palette.
Once displayed, the tool palette works in two modes:
-
Operate mode: Click the top (operate) button to enter Operate mode. In this mode, the drawing tool palette is not available, and you interact with the window as normal.
-
Drawing mode: Click the second (drawing) button to enter Drawing mode. The entire tool palette will then be displayed, and you can add text, arrows, boxes, and other shapes to the window.
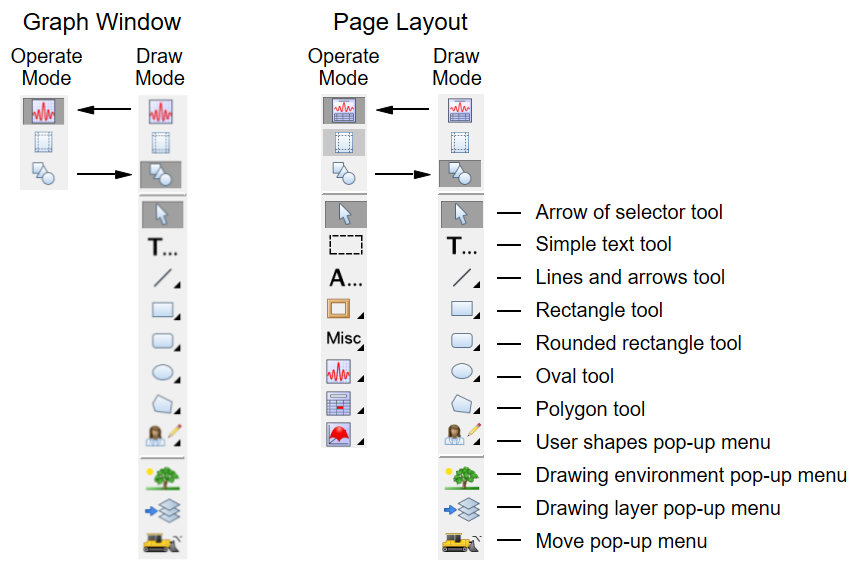
The three bottom icons in the tool palette -- the Drawing Environment icon (tree and grass), Drawing Layer icon, and the Mover icon (bulldozer) -- are pop-up menus. If you press Alt while clicking the Mover icon, you get a pop-up menu that allows you to retrieve offscreen drawing elements, if any.
The icons above with the triangle symbol, when clicked, select a mode of operation for creating various shapes using the mouse. If you click them and hold, they present pop-up menus that allow you to invoke dialogs for creating the shapes.
The Arrow Tool
Use the arrow tool to select, move and resize one or more drawing objects or a user-defined controls.
Selecting, Moving, and Resizing Objects
Click a drawing object once to select it. When selected, small squares called handles appear, defining the object's size. You can drag these handles to resize single or multiple objects. By pressing Shift while clicking a handle, an object resize can be constrained to the horizontal, vertical, or diagonal directions depending on how close the cursor is to these directions. By pressing Alt instead, the resize is constrained to entirely horizontal or entirely vertical, depending on the position of the cursor.
If you click an object and it does not become selected then the object may be in a different drawing layer or it may not in fact be a drawing object at all.
You can select multiple drawing objects by shift clicking additional objects. You can remove an object from a selection by shift clicking a selected object.
You can also select multiple drawing objects by dragging a selection rectangle around a set of drawing objects. Unless you first press Alt, only objects that are completely enclosed by the selection rectangle are included in the selection. With Alt pressed, objects that are merely touched by the selection rectangle are included. You can append additional objects to a selection by pressing Shift before dragging out a selection rectangle.
You can select all objects in the current layer with the Select All item in the Edit menu.
Rotating Objects
You can rotate draw objects by clicking just beyond a selection's visible resizing handles.
When the mouse is over an invisible rotation handle, the cursor changes shape, indicating that you can rotate the object. Click and drag the invisible rotation handle to rotate it.
Duplicating Objects
You can duplicate selected drawing objects using the Duplicate command found in the Edit menu. If, right after duplicating an object, you reposition the duplicated object and duplicate again then the new object will be offset from the last by the amount you just defined.
Deleting Objects
You can delete selected drawing objects by pressing Delete.
Modifying Objects
Double-clicking a drawing object displays a dialog for that object. You can then change any of the settings available in the dialog. Click the Do It button to apply the changes.
Simple Text Tool
The text tool is usually used to create a single line of simple text with the same font, size, style and rotation. You can also create formatted text with multiple lines and all the escape codes supported by annotations - see Annotations.
The text tool is the only way to add text to control panel windows.
To create a line of text, click the simple text icon. The cursor will change shape to a text entry vertical line. Then move the cursor to the location in the window where you want the text origin, and click there to invoke the Create Text dialog.
Casual users can ignore the Anchor pop-up menu. It is used mainly by programmers to ensure that text is aligned properly about the numeric origin (X0,Y0). Any rotation is applied first and then the rotated text is aligned relative to the origin as specified by the anchor setting.
To edit or change a text object, double-click the object with the Arrow tool.
Lines and Arrows Tool
You can use the Lines tool to draw lines by clicking at the desired starting point and then dragging to the desired ending point. Press Shift while drawing to constrain the line to be vertical or horizontal.
If you click and hold on the Lines icon, you get a pop-up menu that takes you to a dialog where you can specify the line numerically. You see a similar dialog if you use the arrow tool to double-click a line. This dialog allows you to change the properties of the line.
The dash pattern pop-up palette is the same as the one used for graph traces. You can adjust the dash patterns by use of the Dashed Lines command in the Misc menu.
The arrow fatness parameter is the desired ratio of the width of the arrow head to its length.
The line thickness and arrow length parameters are specified in terms of points and may be fractional.
Line start and end coordinates depend on the chosen coordinate system. See Drawing Coordinate Systems for detailed discussion. Programmers should note that the ends of a line are centered on the start and end coordinates. This is more obvious when the line is very thick.
Rectangle, Rounded Rectangle, Oval
The Rectangle, Rounded Rectangle, and Oval tools create objects that are defined by an enclosing rectangle. Click and hold on the appropriate icon to invoke dialog where you can specify the object numerically. You see a similar dialog if you use the arrow tool to double-click the object.
Press Shift while initially dragging out the object to create a square or circle. If you press Shift while resizing the object with the arrow tool, you constrain the object in the horizontal, vertical, or diagonal directions depending on how close the cursor is to one of these directions. Thus, when you Shift-drag along a diagonal the sides are constrained to equal length, but if you Shift-drag along a horizontal or vertical direction, the object is resized along only one of these directions. If instead you press Alt, dragging along a diagonal resizes the object proportionally.
The Erase fill mode functions by filling the area with the current background color of the window. The fill background color is used only when a fill pattern other than Solid or Erase is chosen.
An object is always drawn inside the mathematical rectangle defined by its coordinates no matter how thick the lines. This differs from straight lines which are centered on their coordinates.
To adjust the corners of a rounded rectangle, double-click the object and edit the RRect Radius setting in the resulting dialog. Units are in points.
Arcs and Circles
To draw an arc or a circle by center and radius, click and hold on the Oval icon and choose Draw Arc from the resulting pop-up menu. Click and drag to define the center and the radius or start angle. Click again without moving the mouse to create a circle or move and click to define the stop angle for an arc. A variety of click and click-drag methods are supported and experimentation is encouraged.
To edit an arc, click and hold on the Oval icon in the draw tool panel and then choose Edit Arc from the resulting pop-up menu. If necessary, click on an arc to select it. You can then drag the origin, radius, start angle, and stop angle.
To change the appearance of an arc, double click to get to the Modify Arc dialog. Unlike Ovals, Arcs honor the current dash pattern and arrowhead setting in the same way as polygons and Beziers. The center of an arc or circle can be in any coordinate system (see Drawing Coordinate Systems) but the radius is always in points.
Polygon Tool
The polygon tool creates or edits drawing objects called polygons and, in graphs, it can create or edit waves. For details, see Drawing Polygons and Bezier Curves.
The User Shapes Tool
This tool creates drawing objects defined by procedure code written by you or another user. For details see the DrawUserShape operation and for examples open the User Draw Shapes experiment.
Open the User Draw Shapes experiment
Drawing Environment Pop-Up Menu
The Drawing Environment pop-up menu allows you to change properties such as line thickness, color, fill pattern, and other visual attributes.
You can change the attributes of existing objects, or you can change the default attributes of objects you are yet to create.
To change the attributes of existing objects, first select them. Then use the Environment pop-up menu to modify the attributes.
To change the default attributes of objects yet to be created, make sure no objects are selected. Then use the Environment pop-up menu to change attributes. From that point on, all new objects will have the new attributes, until you change them again.
The items in the menu do not affect all types of objects. The Fill Mode and Fill Color commands affect only enclosed shapes. The Line Dash and Line Arrow commands do not affect rectangles and ovals.
You can invoke the Modify Draw Environment dialog to change multiple attributes by choosing All from the Environment pop-up menu or by double-clicking an object.
Double-clicking multiple selected objects or groups of objects with the selector tool also invokes the Modify Draw Environment dialog. In this case, the properties shown are those of the first selected object but if you change a property then all selected objects are affected.
Double-clicking a single drawing object with the selector tool invokes a specific dialog for objects of that type.
Drawing Layer Pop-Up Menu
The Drawing Layer pop-up menu selects the active drawing layer. You can create and edit drawing objects in the active drawing layer only. See Drawing Layers for details.
Mover Pop-Up Menu
The Mover pop-up menu performs various actions:
-
Changing the front-to-back relationship of drawing objects in a given layer
-
Aligning drawing objects or controls to each other or to a grid
-
Grouping and ungrouping drawing objects
-
Retrieving drawing objects or controls that are off screen
Use the Bring to Front, Send to Back, Forward and Backward commands to adjust the front-to-back relationship of objects within the current drawing layer.
The Align command adjusts the positions of all the selected drawing objects relative to the first selected object. This works on controls as well as drawing objects.
The Distribute command evens up the horizontal or vertical spacing between selected objects. This operation is especially handy when working with buttons or other controls in a user-defined panel. This works on controls as well as drawing objects.
The Retrieve command is used to bring offscreen objects back into the viewable area. You can retrieve an offscreen object by selecting it from the Retrieve submenu of the Mover pop-up menu. Alternatively, if you press Alt, and select an object from the resulting pop-up menu, Igor selects the object and displays the Properties dialog. Use this to set the numeric coordinates for the object to bring it back onscreen. Or you can cancel out of the dialog and then press Delete to remove the object. Retrieve works on controls as well as drawing objects.
The Grid submenu provides options for controlling the grid. See Drawing Grid for details.
Drawing Grid
You can display a grid and force objects to snap to the grid, whether it is visible or not. You do this using the Mover pop-up menu Grid submenu.
The default grid is in inches with 8 subdivisions. The grid origin is the top-left corner of the window or subwindow. Use the ToolsGrid operation to set the grid properties. You can independently specify the X and Y grids and set the origin, major grid spacing, and number of subdivisions.
When grid snap is on, you can turn it off temporarily by engaging Caps Lock.
When dragging an object, the corner nearest to where you clicked to start dragging the object is the corner that will be snapped to the grid. You can also snap existing objects to the grid by selecting the Align to Grid menu item from the Mover popup menu.
Set Grid from Selection
If a single object is selected, Set Grid from Selection will set the grid origin at the top left corner of the object. It two objects are selected, the origin will be set to the top left corner of the first object and the major grid spacing will be defined by the distance to the top left corner of the second object. If either the horizontal or vertical separation is small, then a uniform (equal X and Y) grid is defined by the larger distance. Otherwise the horizontal and vertical grids are set from the corresponding distances.
Grid Style Function
The Style Function submenu allows you use to create a style function or to run one that you previously created. Style functions are created in the main procedure window with names like MyGridStyle00. You can edit these to provide more meaningful names.
Drawing Coordinate Systems
A unique feature of Igor's drawing tools is the ability to choose different coordinate systems. You can choose different systems on an object-by-object basis and for X and Y independently. This capability is mainly for use in graphs to allow your drawings to adjust to changes in window size or to changes in axis scaling.
You specify the coordinate system using pop-up menus found in the drawing Modify dialogs. The available coordinate systems are:
-
Absolute
-
Relative
-
Plot Relative
-
Axis Relative
-
Axis
Absolute
In absolute mode, coordinates are measured in points, or control panel units for control panels, relative to the top-left corner of the window. Positive x is toward the right and positive y is toward the bottom. In this mode the position and size of objects are unaffected by changes in window size. This is the default and recommended mode in page layouts and control panels.
If you shrink a window, it is possible that some objects will be left behind and may find themselves outside of the window (offscreen). In addition, if you copy an object with absolute coordinates from one window and then paste it in another smaller window it will be placed where the coordinates specify, even if it is offscreen. If you think this has happened, use the Mover pop-up menu to retrieve any offscreen objects or expand the window until the stray objects are visible.
Relative
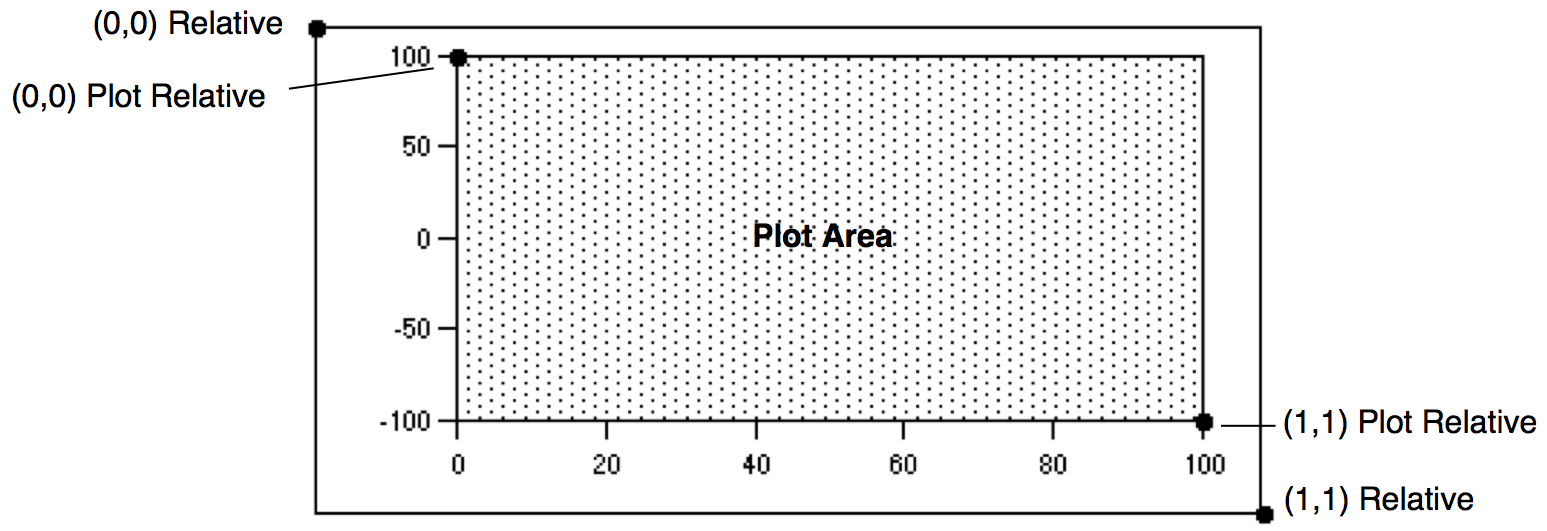
In this mode, coordinates are measured as fractions of the size of the window. Coordinate values x=0, y=0 represent the top-left corner while x=1,y=1 corresponds to the bottom-right corner. Use this mode if you want your drawing object to remain in the same relative position as you change the window size.
This mode will produce near but not exact WYSIWYG results in graphs. This is because the margins of a graph depend on many factors and only loosely on the window size. This mode gives good results for objects that don't have to be positioned precisely, such as an arrow pointing from near a trace to near an axis. It would not be suitable if you want the arrow to be positioned precisely at a particular data point or at a particular spot on an axis. For that you would use one of the next three coordinate systems.
Plot Relative (Graphs Only)
This system is just like Relative except it is based on the plot rectangle rather than the window rectangle. The plot rectangle is the rectangle enclosed by the default left and bottom axes of a graph and their corresponding mirror axes. The coordinates x=0, y=0 represent the top-left corner while x=1,y=1 corresponds to the bottom-right corner. This is the default and recommended mode for graphs.
The Plot Relative system is ideal for objects that should maintain their size and location relative to the axes. A good example is cut marks as used with split axes. In most cases, Plot Relative or Axis Relative is a better choice than the more complex Axis-Based (Graphs Only) system discussed below.
Axis Relative (Graphs Only)
This system is just like Plot Relative except it is based on the plot rectangle expanded by any axis standoff. If there is no axis standoff, the result is the same as using Plot Relative. Axis standoff is described under Modifying Axes[Axis Tab].
Axis Relative coordinates require Igor Pro 9.00 or later.
The Axis Relative system is ideal for objects that should maintain their size and location relative to the axes including the standoff areas. A good example is a background highlighting color rectangle that starts or ends at the expanded rectangle's edges, avoiding a standoff gap.
The following graphic shows two rectangles, each with an X range of 0 to 1 but using Axis Relative for the top rectangle and Plot Relative for the bottom rectangle:
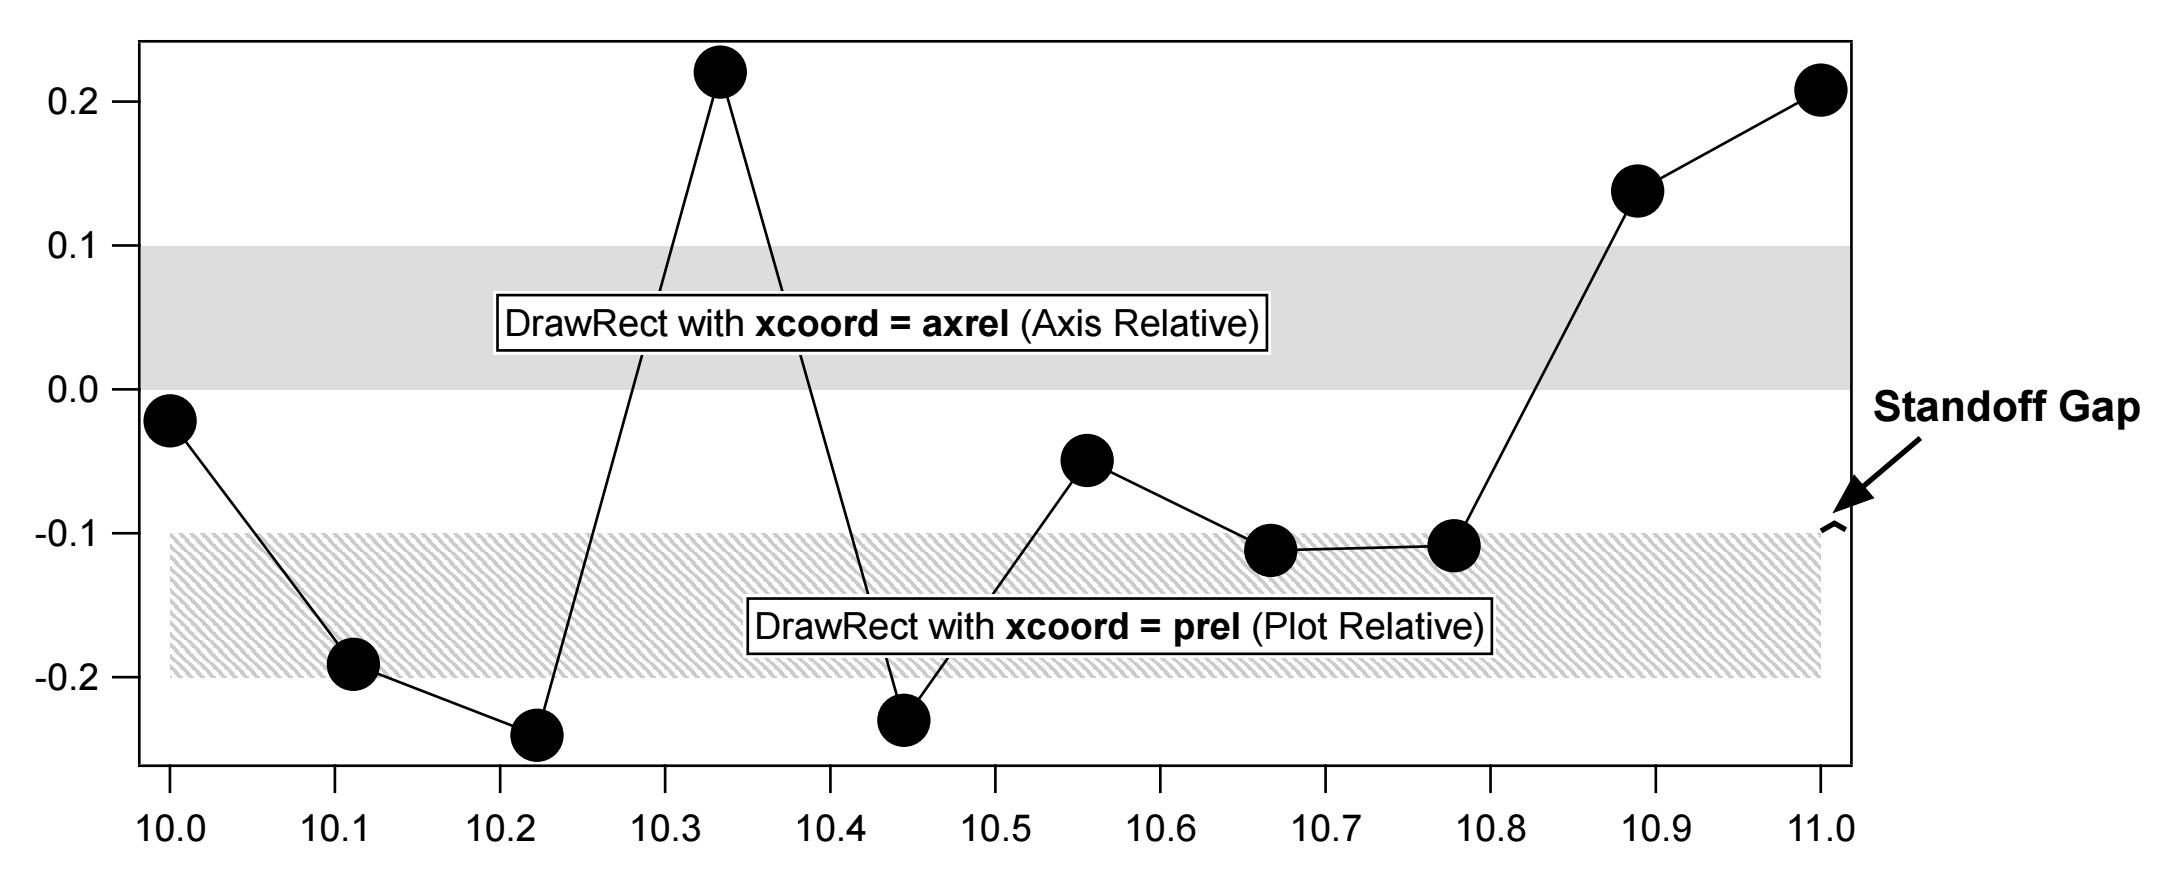
Both rectangles use axis-based coordinates, described next, for their Y coordinates.
Axis-Based (Graphs Only)
The pop-up menu for the X coordinate system includes a list of the horizontal axes and the pop-up menu for the Y coordinate includes a list of the vertical axes. When you choose an axis coordinate system, the position on the screen is calculated just as it is for wave data plotted against that axis, with the exception that drawing object coordinates are not limited to the plot area. This mode is ideal when you want an object to stick to a feature in a wave even if you zoom in and out.
Axes are treated as if they extend to infinity in both directions. For this reason along with the fact that axis ranges can be very dynamic, it is very easy to end up with objects that are offscreen. You can use the Mover pop-up menu Retrieve submenu to retrieve objects or, if you press Alt before clicking the Mover icon, you can edit the numerical coordinates of each offscreen object. You can also end up with objects that are huge or tiny. It is best to have the graph in near final form before using axis-based drawing objects.
Axis-based coordinates are of particular interest to programmers but are also handy for a number of interactive tasks. For example you can easily create a rectangle that shades an exact area of a plot. If you use axis coordinate systems then the rectangle remains correct as the graph is resized and as the axis ranges are changed. You can also create precisely positioned drop lines and scale (calibrator) bars.
Drawing Layers
Layers allow you to control the front-to-back layering of drawing objects relative to other window components. For example, if you want to demarcate a region of interest in a graph, you can draw a shaded rectangle into a layer behind the graph traces. If you drew the same rectangle into a layer above the traces then the traces would be covered up.
Each window type supports a number of separate drawing layers. For example, in graphs, Igor provides four pairs of drawing layers.
You can see the layer structure for the current window and change to a different layer by clicking the layer icon  . The current layer is indicated by a check mark.
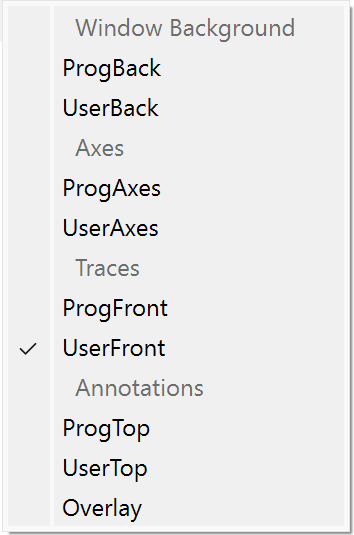
Drawing layers have names. This table shows the names of the layers and which window types support which layers:
| Graphs | Page Layouts | Control Panels | ||
|---|---|---|---|---|
| ProgBack | ProgBack | ProgBack | ||
| UserBack | UserBack | UserBack | ||
| ProgAxes | ||||
| UserAxes | ||||
| ProgFront | ProgFront | |||
| UserFront | UserFront | |||
| ProgTop | ||||
| UserTop | ||||
| Overlay | Overlay | Overlay | ||
Drawing layers come in pairs named ProgSomething and UserSomething. User layers are provided for interactive drawing while Prog layers are provided for Igor programmers. This usage is just a recommended convention and is not enforced by Igor. The purpose of the recommendation is to allow Igor procedures to have free access to the Prog layers. If you were to draw into a Prog layer and then ran a procedure that used that layer then your drawing could be damaged or erased.
The ProgTop and UserTop drawing layers (which draw above annotations) were added in Igor Pro 10.00.
The topmost layer is the Overlay layer. It is provided for programmers who wish to add user-interface drawing elements without disturbing graphic elements, such as markups indicating where changes are needed. The Overlay layer is not included when printing or exporting graphics. This layer was added in Igor Pro 7.00.
Only drawing objects in the current layer can be selected. If you find you cannot select a drawing object then it must be in a different drawing layer. You will have to try the other layers until you find the right one, or examine the window's recreation macro.
To move an object between layers you can cut, switch layers and then paste. Alternatively, you can right-click the object(s) and choose the destination layer from the "Move to Layer" submenu.
Drawing Polygons and Bezier Curves
The polygon tool creates or edits drawing objects called polygons and, in graphs, it can create or edit waves.
A polygon is an open or closed shape with one or more line segments, or edges. Polygons can be filled with a color and pattern and can have arrow heads attached to the start or end.
Although you may create a closed polygon by making the beginning and ending points the same, Igor does not recognize it as a closed shape. You can thus open the Polygon by moving either the beginning or ending points. This is subject to change in a future release.
Creating a New Polygon
You can create a polygon in one of two ways:
-
Segment Mode: Each click defines a new vertex.
-
Freehand Mode: Igor adds new vertices as you sweep out a smooth curve.
To create a polygon using segment mode, click the polygon icon once. Then click at the desired location for the beginning of the polygon. As you move the cursor, you create a line segment. A second click anchors the first line segment, and begins the second. You can keep drawing line segments until the polygon is finished.
Pressing the Shift key while dragging constrains movement to angles that are increments of 15 degrees from horizontal or vertical.
Stop drawing by double-clicking to define the last vertex or by clicking at the first vertex. You then automatically enter edit mode, the cursor changes to  , and vertices are marked with square handles. (For Bezier curves, vertices are called "anchors".) In edit mode, you can reshape the polygon. To exit edit mode click the arrow tool.
To create a polygon using freehand mode, to edit an existing polygon, or to draw or edit a Bezier curve, click and hold on the polygon icon until the pop-up menu appears. Then choose one of these items:
-
Draw Poly: Enters the create-segmented-polygon mode in which a click starts a new segmented polygon. This is identical to a single click on the icon.
-
Freehand Poly: Enters create-freehand-polygon mode in which a click starts a freehand polygon. Click and drag to sweep out a smooth curve as long as you press the mouse button. When you release the mouse button, you automatically enter edit mode, where you can change the shape.
-
Edit Poly: Enters edit-polygon mode for editing an existing polygon as described in detail in the next section.
-
Draw Bezier: Enters create-Bezier-polygon mode in which a click starts a new Bezier polygon. Click and drag to define anchor and control points. Click on the first point to close the curve.
-
Edit Bezier: Enters edit-Bezier-polygon mode for editing an existing Bezier polygon as described in detail in the next section. You may need to click on a Bezier curve to select it.
Editing a Polygon
To enter edit mode, click and hold on the polygon icon, and choose Edit Poly from the pop-up menu. Then click the polygon object you want to edit.
While in edit mode you can move, add, and delete vertices, and move line segments:
-
Move a vertex: Click and drag the vertex to move it and stretch the associated edges.
-
Create a new vertex: Click between vertices in a line segment.
-
Delete vertices: Press the Alt key and click the vertex you want to delete.
-
Offset pairs of vertices: Press the Ctrl key, click a line segment, and drag.
-
Create a closed polygon: Drag a vertex at one end of the polygon on top of the vertex at the other end until the cursor changes to show a small circle on the bottom-right of the cursor. The vertices are now joined and move together until separated.
Joined vertices are represented by as small circles ("normal" vertices are represented as small squares).
-
Separate a closed polygon's endpoints: Right-click the joined vertices and choose "Separate Polygon Endpoints".
-
Hold down the Shift key for straight lines: Pressing the Shift key while dragging a vertex constrains the vertex location to horizontal or vertical lines through the original vertex location or to lines through the vertex's original location and the locations of the two neighboring vertices.
-
Use the Snap Grid to easily align vertices vertically and horizontally. Click the "mover" tool's popup menu and choose "Visible" and then "Snap" to show and snap to the grid.
-
Undo the last action using Ctrl-Z, and "redo" with Shift-Ctrl-Z.
-
Exit edit mode by clicking the arrow tool.
-
Change the appearance of the polygon.
After exiting edit mode, you can use the environment icon or the right-click contextual menu to adjust the other attributes of a selected polygon, such as line size and fill color/pattern. You can even add arrows to the start or end of the polygon.
Double-click a polygon with the arrow tool to invoke the Modify Polygon dialog to make the same changes.
-
Position or scale the curve using the Modify Polygon dialog.
The X0 and Y0 Position settings determine the location of the first point more exactly than clicking and dragging the vertices.
You can change the size of the polygon by modifying the H Scale and V Scale parameters in the dialog. For example, enter 0.5 for both settings to shrink the polygon to half its normal size.
Segmented Polygons
It is possible to separate a polygon into segments by adding coordinate pairs that are NaN. By default, such segments are drawn as if they are separate polygons. If you fill such a polygon with a color having transparency, any overlapping areas will darken because they are painted twice.
If you use SetDrawEnv subpaths=1, the segments are sub paths within a single polygon. The segments are drawn with no line linking the subpaths, but when filled the entire polygon is treated as a single polygon, making it possible to create a polygon with internal holes. The way those holes are filled is affected by the SetDrawEnv fillRule keyword.
The subpaths keyword applies only to polygons and Bezier curves created with DrawPoly and DrawBezier, not to those created manually. You can manually create subpaths by entering Edit Polygon mode, right-clicking a line segment of the polygon, and choosing Break Line.
A side-effect of setting SetDrawEnv subpaths=1 is a change to the way arrows are added to segmented polygons: with SetDrawEnv subpaths=0 (the default), arrows are added to each segment as if they are separate polygons. With subpaths=1, the arrows are added only to the first or last points in the entire polygon.
Editing a Bezier Curve
There are a number of operations you can perform to edit a Bezier curve:
-
Move an anchor point: Click and drag an anchor point to move it and stretch the associated curves.
-
Move control point(s): Click and drag the control point. Control points look like a red dot attached by a line to a square or round anchor point. If the anchor associated with the control point has another control point on the other side of the anchor, dragging one control point moves both.
-
Move only one of two control points associated with an anchor point: Hold down the Alt key while clicking and dragging the control point to move it independently of any control point on the other side of the associated anchor.
-
Move a control point that is directly above an anchor point: Press the Ctrl key, and then click the control point (and anchor); dragging will move the control point instead of the anchor under it.
-
Create a new anchor point: Click the curve between anchor points.
-
Delete an anchor point: Hold down the Alt key and then click the anchor point.
-
Create a closed Bezier curve: Drag an anchor at one end of the curve on top of the anchor at the other end until the cursor changes to show a small circle on the bottom-right of the cursor. The anchors are now joined and move together until separated.
Joined anchors are represented by as small circles ("normal" anchors are represented as small squares). A green control point handle indicates a control point that has a matching control point only because the curve is closed.
-
Separate a closed Bezier curve's endpoints: Right-click the joined anchor and choose "Separate Bezier Endpoints".
-
Modify an anchor point's control points: Right-click an anchor to display a contextual menu that sets the lengths and angles of the control points on each side of the anchor.
For example, choosing "Make Sharp Corner" sets the length of the control points to 0, so they lay directly on top of the anchor, making that point of the Bezier identical to a regular polygon. During editing mode, a "sharp corner" looks like a square marker with a red round marker inside of it. However, a "sharp" joined anchor's appearance remains a green round marker, just like a "smooth" joined anchor.
-
Modify a control point or the "other" control point: Right-click a control point to display a contextual menu that sets the lengths and angles of the clicked control point or the control point on the "other side" of the control point's anchor.
For example, choosing "Make Other Control Point Parallel" sets the angle of the other control point so that the Bezier curve is tangent on both sides of the anchor to the angle already defined by the clicked control point.
-
Modify the control points that define the curve between two anchors: Right-click the curve between anchors to display a contextual menu that sets the lengths and angles of the two control points attached to the two anchors that start and end that curve.
For example, choosing "Make 90 Degree Arc" sets the angles and lengths of the two control points to draw a 90 degree arc between the two anchor points. In order for this choice to be available, the line between the two anchors must have some curve to it so that the correct orientation of the arc can be chosen.
Choosing "Break Curve to Start Another Bezier" replaces the two control points between the anchors with one (NaN,NaN) coordinate pair to draw two separate Beziers curves. See Segmented Bezier Curves below for details. Choosing "Remove All Bezier Breaks" removes all (NaN,NaN) coordinate pairs from the Bezier object.
-
Hold down the Shift key for straight lines: Pressing the Shift key while dragging a Bezier control handle constrains movement to angles that are increments of 15 degrees from horizontal/vertical.
Pressing the Shift key while dragging while dragging a polygon or Bezier anchor point snaps the anchor location to the nearest of lines through the original anchor location and through the locations of the two neighboring anchor points. Holding Shift while dragging also constrains movement to horizontal or vertical directions.
-
Use the Snap Grid to easily align vertices vertically and horizontally. Click the "mover" tool's popup menu and choose "Visible" and then "Snap" to show and snap to the grid.
-
Undo the last action using Ctrl-Z, and "redo" with Shift-Ctrl-Z.
-
Exit edit mode by clicking the arrow tool.
-
Change the appearance of the Bezier cuve.
After exiting edit mode, you can use the environment icon or the right-click contextual menu to adjust the other attributes of a selected polygon or Bezier curve, such as line size and fill color/pattern. You can even add arrows to the start or end of the Bezier curve.
You can also double-click a Bezier curve to invoke the Modify Bezier dialog to make the same changes.
-
Position or scale the curve using the Modify Bezier dialog.
The X0 and Y0 Position settings determine the location of the first point more exactly than clicking and dragging the curve.
You can change the size of the Bezier curve by modifying the H Scale and V Scale parameters in the dialog. For example, enter 0.5 for both settings to shrink the Bezier curve to half its normal size.
Segmented Bezier Curves
It is possible to separate a Bezier curve into segments by adding coordinate pairs that are NaN. By default, such segments are drawn as if they are separate Bezier curves. If you fill such a curve with a color having transparency, any overlapping areas will darken because they are painted twice.
If you use SetDrawEnv subpaths=1, the segments are treated as subpaths within a single Bezier curve. The segments are drawn with no line linking the subpaths, but when filled the entire curve are treated as a single Bezier curve, making it possible to create a curve with internal holes. The way those holes are filled is affected by the SetDrawEnv fillRule keyword.
The subpaths keyword applies only to polygons and Bezier curves created with DrawPoly and DrawBezier, not to those created manually. You can manually create subpaths by entering Edit Bezier mode, right-clicking the curve, and choosing Break Curve.
A side-effect of setting SetDrawEnv subpaths=1 is a change to the way arrows are added to segmented Bezier curves. With SetDrawEnv subpaths=0 (the default), arrows are added to each segment as if they are separate Bezier curves. With subpaths=1, the arrows are added only to the first or last points in the entire Bezier curve.
This demo shows how to create a donut from two circle approximations using five anchor points starting and ending at the 6 o'clock position, with anchors at the 3, 12, 9 o'clock positions. A NaN, NaN pair separates the two segments.
Function DemoDrawBezierAndSubpath()
	Display as "Bezier Curves With Subpaths"
	ModifyGraph width={Aspect,1}, margin=18, expand=2

	// Draw a circle below for comparison
	SetDrawLayer/K UserBack

	// Set plot relative coords, 0-1, no fill
	SetDrawEnv xcoord=prel, ycoord=prel, fillpat= 0, save
	SetDrawEnv linethick= 3, linefgc= (32792,65535,1) // wide light green stroke
	DrawOval 0,0,1,1

	// Control point length = 0.55.. * radius for a circle made with 90 degree segments
	Variable radius= 0.5
	Variable len= 0.55191502449 * radius
	Variable xc= 0.5, yc= 0.5 // circle origin

	// Compute four 90 degree Bezier curve segments, requires 5 anchors
	Variable anchor0x, anchor0y, t0x, t0y
	Variable l1x, l1y, anchor1x, anchor1y, t1x, t1y
	Variable l2x, l2y, anchor2x, anchor2y, t2x, t2y
	Variable l3x, l3y, anchor3x, anchor3y, t3x, t3y
	Variable l4x, l4y, anchor4x, anchor4y

	// Starting anchor point has only a trailing control point
	anchor0x= xc; anchor0y=yc+radius    // starting point at 6 o'clock
	t0x= anchor0x+len; t0y= anchor0y    // trailing control point

	// Second anchor point has both leading and trailing control points
	l1x=xc+radius; l1y = yc+len         // leading control point
	anchor1x= xc+radius; anchor1y= yc   // 3 o'clock anchor
	t1x=l1x; t1y = yc-len               // trailing control point

	// Third anchor point has both leading and trailing control points
	l2x=xc+len; l2y = yc-radius         // leading control point
	anchor2x= xc; anchor2y= yc-radius   // 12 o'clock
	t2x=xc-len; t2y = l2y               // trailing control point

	// Fourth anchor point has both leading and trailing control points
	l3x=xc-radius; l3y = yc-len         // leading control point
	anchor3x= xc-radius; anchor3y= yc   // 9 o'clock
	t3x=l3x; t3y = anchor3y+len         // trailing control point

	// Last (fifth) anchor point has only a leading control point
	l4x=xc-len; l4y = yc+radius         // leading control point
	anchor4x= xc; anchor4y= l4y         // 6 o'clock, same as first anchor

	// Draw Bezier curve above reference circle using subpath
	SetDrawLayer/K UserFront
	SetDrawEnv xcoord=prel, ycoord=prel, subpaths=1, fillRule=1, save
	SetDrawEnv linethick= 1, linefgc= (65535,0,0) // red stroke
	SetDrawEnv fillfgc= (16385,28398,65535,49151),fillpat= 1 // fill transparent blue

	// Draw outer circle
	// One command per anchor for clarity
	DrawBezier anchor0x, anchor0y, 1,1, {anchor0x, anchor0y, t0x, t0y}
	DrawBezier/A {l1x, l1y, anchor1x, anchor1y, t1x, t1y}
	DrawBezier/A {l2x, l2y, anchor2x, anchor2y, t2x, t2y}
	DrawBezier/A {l3x, l3y, anchor3x, anchor3y, t3x, t3y}
	DrawBezier/A {l4x, l4y, anchor4x, anchor4y}

	// Add NaN,NaN subpath breakpoint
	DrawBezier/A {NaN, NaN}

	// Append smaller radius circle (as subpath)
	radius= 0.25
	len= 0.55191502449 * radius

	anchor0x= xc; anchor0y=yc+radius   // 6 o'clock anchor
	t0x= anchor0x+len; t0y= anchor0y

	l1x=xc+radius; l1y = yc+len
	anchor1x= xc+radius; anchor1y= yc  // 3 o'clock anchor
	t1x=l1x; t1y = yc-len

	l2x=xc+len; l2y = yc-radius
	anchor2x= xc; anchor2y= yc-radius  // 12 o'clock anchor
	t2x=xc-len; t2y = l2y

	l3x=xc-radius; l3y = yc-len
	anchor3x= xc-radius; anchor3y= yc  // 9 o'clock anchor
	t3x=l3x; t3y = anchor3y+len

	l4x=xc-len; l4y = yc+radius
	anchor4x= xc; anchor4y= l4y	  // 6 o'clock, same as first anchor

	DrawBezier/A {anchor0x, anchor0y, t0x, t0y}
	DrawBezier/A {l1x, l1y, anchor1x, anchor1y, t1x, t1y}
	DrawBezier/A {l2x, l2y, anchor2x, anchor2y, t2x, t2y}
	DrawBezier/A {l3x, l3y, anchor3x, anchor3y, t3x, t3y}
	DrawBezier/A {l4x, l4y, anchor4x, anchor4y}

	// Draw a half-circle using waves
	Make/O bezierX= {anchor0x, t0x, l1x, anchor1x, t1x, l2x, anchor2x }
	Make/O bezierY= {anchor0y, t0y, l1y, anchor1y, t1y, l2y, anchor2y }
	SetDrawEnv linethick= 2, linefgc= (0,0,0) // black stroke
	DrawBezier anchor0x, anchor0y, 1,1, bezierX, bezierY
End
Polygon and Bezier Curve Fill Rules
Simple polygons and Bezier curves with no intersecting edges are filled unambiguously - points within the shape are filled with color. But how do you decide what is inside and what is outside if the shape has intersecting edges?
There are two rules in common use: the Even-Odd rule and the Non-Zero Winding rule. Igor uses the Winding rule by default:
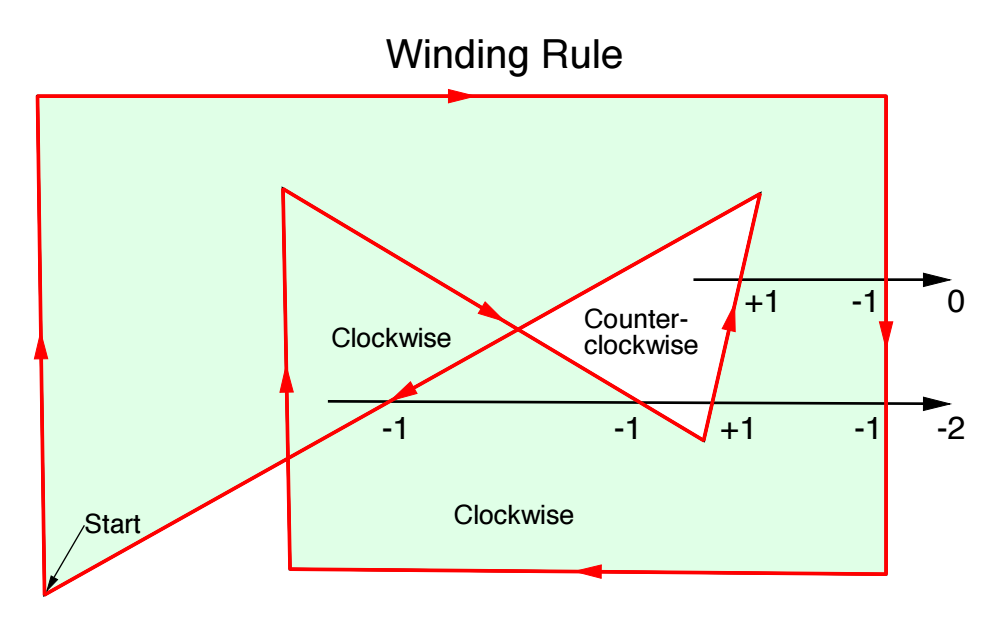
Starting at a given point, draw a line to infinity. If an edge is crossed and that edge is drawn from up to down (or clockwise with respect to the start of the line) subtract one. If the edge is drawn from down to up (or counterclockwise), add one. If the result is non-zero, it is inside and should be colored.
You can request the Even-Odd rule using SetDrawEnv fillRule=1. The fillRule keyword applies only to polygons and Bezier curves created with DrawPoly and DrawBezier, not to those created manually. Manually-created polygons and Bezier curves follow the winding fill rule by default; you can change the rule using the Modify Polygon or Modify Bezier dialog.
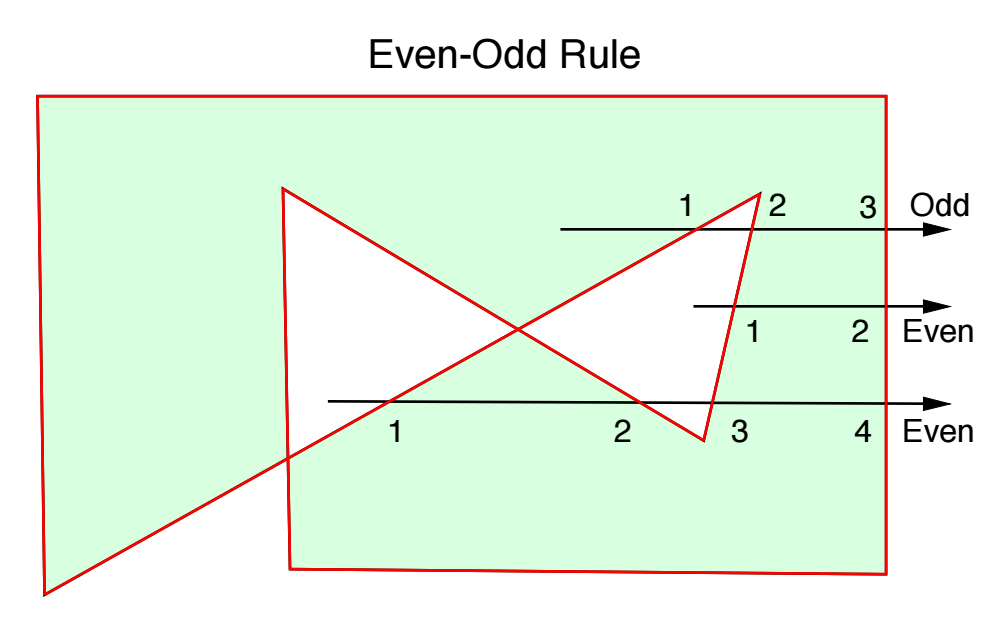
Starting at a given point, draw a line to infinity. Count the number of edges crossed. If the result is an odd number, the point is inside. If it is even, it is outside.
Drawing and Editing Waves
In a graph, you can use the polygon tool to create or edit waves using the same techniques just described for drawing polygons. Click and hold on the polygon tool. Igor displays a pop-up menu containing, in addition to the usual polygon and Bezier commands, the following wave-drawing commands:
- Draw Wave
- Draw Wave Monotonic
- Draw Freehand Wave
- Draw Freehand Wave Monotonic
- Edit Wave
- Edit Wave Monotonic
The first four commands create and add a pair of waves with names of the form W_XPolynn and W_YPolynn where nn are digits chosen to ensure the names are unique. Draw Wave and Draw Freehand Wave work exactly like the corresponding polygon drawing described above. The monotonic variants prevent you from backtracking in the X direction. As with polygons, you enter edit mode when you finish drawing.
You can edit an existing wave, or pair of waves if displayed as an XY pair, by choosing one of the Edit Wave commands and then clicking the wave trace you wish to edit. Again, the monotonic variant prevents backtracking in the X direction. If you edit a wave that is not displayed in XY mode then you cannot adjust the X coordinates since they are calculated from point numbers.
You can use the GraphWaveDraw and GraphWaveEdit operations, described in Programmatic Drawing, to start wave drawing or editing programmatically.
Drawing Exporting and Importing
Copy/Paste Within Igor
You can use the Edit menu to cut, copy, clear and paste drawing objects just as you would expect.
Drawn objects retain all of their Igor properties as long as they are not modified by any other program. If, however, you export an Igor drawing to a program and then copy it back to Igor, the picture will no longer be editable by Igor, even if you made no changes to the picture.
When selected drawing objects are copied to the clipboard and then pasted, they retain their coordinates. However, this can cause the pasted objects to be placed offscreen if the object's coordinates don't fall within the displayed portion of the coordinate systems.
If you find that pasting does not yield what you expected, perhaps it is because some objects were pasted off-screen. You can use the Mover icon to examine or retrieve any of these offscreen objects.
Pasting a Picture Into a Drawing Layer
Pasting a picture from a drawing program may work differently than you expect. Igor does not attempt to take the picture apart to give you access to the component objects. Instead, Igor treats the entire picture as a single object that you can move and resize but not otherwise adjust.
You can change the scale of a pasted picture by either dragging the handles when the object is selected or by double-clicking the object and then setting the x and y scale factors in the resulting dialog.
Programmatic Drawing
All of the drawing capabilities in Igor can be used from Igor procedures. This section describes drawing programming in general terms and provides strategies for use along with example code.
The programmable nature of drawing in Igor is especially useful in creating new graph types. For example, even though Igor does not support polar plots as a native graph type we were able to create a polar plot package that produces high-quality polar graphs. (To see a demo of the package, choose File->Example Experiments->Graphing Techniques->New Polar Graph Demo.) Nonprogrammers can use the package as-is while programmers can modify the code to suit their purposes or can extract useful code snippets for their own projects.
You can get a quick start on a drawing programming project by first drawing interactively and then asking Igor to create a recreation macro for the window (click the close button, save the recreation macro, and look in the Procedure window). You can then extract useful code snippets for your project. Frequently all you will have to do is replace literal coordinate values with calculated values and you are in business.
Drawing Operations
Here is a list of operations related to drawing:
| DrawAction | DrawArc | DrawBezier | DrawLine | |||
| DrawOval | DrawPICT | DrawPoly | DrawRect | |||
| DrawRRect | DrawText | DrawUserShape | GraphNormal | |||
| GraphWaveDraw | GraphWaveEdit | HideTools | SetDashPattern | |||
| SetDrawEnv | SetDrawLayer | ShowTools | ToolsGrid | |||
SetDrawLayer Operation
Use SetDrawLayer to specify which layer the following drawing commands will affect. If you use the /K flag then the current contents of the given drawing layer are deleted. See Drawing Programming Strategies for considerations in the use of SetDrawLayer and the /K flag.
SetDrawEnv Operation
This is the workhorse command of the drawing facility. It is used to specify the characteristics for a single object, to specify the default drawing environment for future objects, and to create groups of objects.
You can issue several SetDrawEnv commands in sequence; their effect is cumulative. By default, the group of SetDrawEnv commands affects only the next drawing command. Drawing commands that follow the first will use the default settings that were in effect before the SetDrawEnv commands were issued. For instance, these SetDrawEnv commands change the font and font size for only the first of the two DrawText commands:
SetDrawEnv fname="Courier New"
SetDrawEnv fsize=18							// 18 point Courier New, commands accumulate
DrawText 0,1,"This is in 18 point Courier New"
DrawText 0,0,"Has font and size in use before SetDrawEnv commands"
Use the save keyword in the SetDrawEnv specification to make the settings permanent. The usual use of the save keyword is at the end of the last SetDrawEnv command in a series. The permanent settings allow you to draw a number of objects all with the same characteristics without having to reissue SetDrawEnv commands before each object.
To create a grouping of objects, simply bracket a group of drawing commands with SetDrawEnv commands using the gstart and gstop keywords. Grouping is purely a user interface concept. Objects are drawn exactly the same regardless of grouping.
Draw<object> Operations
These operations, along with SetDrawEnv, operate differently depending on whether or not drawing objects are selected in the target window. If, for example, a rectangle is selected in the target window and a DrawRect command is executed then the selected rectangle is changed. If, on the other hand, no rectangle is selected then a new rectangle is created. This behavior exists to support interactive drawing and is not useful to Igor programmers, since there is no programmatic way to select a drawing object. Normally, you will be creating new objects rather than modifying existing objects.
As you can see from the format of the commands, generally all you specify in the commands themselves are the coordinates. Properties such as color and line thickness are specified by SetDrawEnv commands preceding the Draw<object> commands. The exception is DrawText where you specify the text to be drawn.
DrawPoly and DrawBezier Operations
The DrawPoly and DrawBezier operations come in the following two types:
-
Literal: You can specify the vertices or control points with a set of literal numbers. (Polygons and Bezier curves created interactively are always of the literal variety.)
-
Wave: You can use waves to define the vertices or control points.
Because polygons and Bezier curves can be of unlimited length, the /A flag allows object definitions to extend over multiple lines.
It is legal to specify a polygon with only a single point. Use this to set up a loop to append vertices to the origin vertex. Note that if you fail to add vertices and leave the polygon with just one vertex then the user will not be able to see or select the polygon.
Literal Versus Wave
As a programmer, you must choose either the literal or the wave polygon type when creating a polygon or Bezier curve. This section explains the differences between the two.
The advantage of the literal method is that it does not clutter the experiment with numerous waves that may be distracting to the user. It also has the advantage that all such objects are independent of one another.
With the wave method, objects are not independent. If the user duplicates an object, or runs a window recreation macro several times, then all the objects would be linked via the wave. If the user then edits one of the objects, those edits would affect all of the associated objects; this could also be considered an advantage of the method.
A disadvantage of the literal method is that when Igor creates a recreation macro for a window containing literal method objects then all of the vertices or control points have to be specified in text. This can create huge macros that take a lot of time to create and to run. Because Igor uses the recreation macro technique when saving and restoring experiments, the use of large literal method objects can dramatically lengthen experiment save and restore time.
Wave method objects do not have this disadvantage. One nifty feature of the wave method is that you can read back the vertices or control points after the user has edited the object. Another advantage of the wave method is that you can calculate new vertices or control points at any time and the dependent objects will be automatically updated.
Screen Representation
It is important to note that the value of the first polygon vertex does not determine the location of the first vertex on the screen. The location is specified by the xOrg, yOrg parameters. Effectively the value of the first vertex is subtracted from all the vertices and then the value of the origin is added to all vertices. Thus the following commands create the exact same representation on the screen:
DrawPoly 120,50,1,1,{0,0,20,40,60,15}
DrawPoly 120,50,1,1,{200,300,220,340,260,315}
When programming, the first vertex is usually 0,0. The hScaling, vScaling parameters are probably not of any interest to programmers; use 1 for both values.
GraphWaveDraw, GraphWaveEdit, and GraphNormal
These operations relate to graph modes that are only tangentially related to drawing.
-
GraphWaveDraw puts the graph in a mode where the user can draw a wave using the same user interface as polygon drawing.
-
GraphWaveEdit allows the user to edit a wave using the same user interface as polygon editing.
-
GraphNormal puts the user into normal operation mode, and is the equivalent of clicking the top icon in the tool palette.
These operations are provided so a program can allow the user to sketch a region in a graph. The program can then read back what the user did. Unlike the other drawing modes, these wave drawing and edit modes allow user-defined buttons to be active. This is so you can provide a "done" button for the user. The button procedure should call GraphNormal to exit the drawing or edit mode.
The GraphWaveEdit command operates a little differently depending on whether or not you specify a wave with the command. If you do specify a wave then only that wave can be edited by the user. If you let the user choose a wave then he or she can switch to a new trace by clicking it.
Drawing Programming Strategies
There are three distinct ways you can structure your drawing program:
-
Append: You can append the contents of one or more layers.
-
Replace Layer: You can replace the contents of the layers.
-
Replace Group: You can replace the contents of a named group.
The Replace Layer Method
Use this method when you want to maintain a fairly complex drawing completely under program control. For example you may want to extend Igor by adding a new axis type or a new display method or you may want to create a completely new kind of graph. The Polar Graphs package mentioned above utilizes the replace method.
The key to the replace method is the use of the /K flag with the SetDrawLayer command. This "kills" (deletes) the entire contents of the specified layer. After clearing out the layer you must then redraw the entire contents. To do this you will usually have to maintain some sort of data structure to hold all the information required to maintain the drawing.
For example if you are creating an artificial axis package, you will need to maintain user settings similar to those you see in Igor's modify axis dialog. In many cases setting up a few global variables or waves in a data folder will be sufficient. As an example, see the Drawing Axes procedure file in the WaveMetrics Procedures folder.
The Replace Group Method
With named groups created with the SetDrawEnv gname keyword, you can use DrawAction to delete the group or to set the insertion point for new drawing commands. See DrawAction for an example.
The Append Method
Use this method to provide convenience features that automate creation of simple drawings. You add a small drawing, such as a drop line, calibration bar, or shading rectangle, to any existing drawing objects in a given layer when the user runs a procedure or clicks a button.
Generally, the drawing will be something the user could have done manually and may want to modify. If you need to specify a layer at all it should be a User layer. Often there will be no need to set the drawing layer at all -- just use the current layer.
You may, however, need to set the layer for specific circumstances. A shading rectangle is an example of an object that should go in a specific layer, since it must be below the traces of a graph. In this case, if you use the SetDrawLayer operation, then you should set the current layer back with "SetDrawLayer UserTop".
If you are using the append method, you should avoid using the Prog layers. This is because they are intended for use where the entire layer is to be replaced under program control.
Another consideration is whether or not you should set the default drawing environment. In general you should not but instead leave the user in control. This varies depending on specific objectives.
Grouping
It is a good idea to use grouping for your drawing. This allows the user to move the entire drawing by merely selecting and dragging it.
Example: Drop Lines
In this example, we show a procedure that adds a line from a particular point on a wave, identified by Cursor A, to the bottom axis. The procedure assumes that the graph has left and bottom axes and that cursor A is on a trace. For clarity, error checking is omitted.
Menu "Graph"
	"Add Drop Line", AddDropLine()
End

 Function AddDropLine()
	Variable includeArrow = 2		// 1=No, 2=Yes
	Prompt includeArrow,"Include arrow head?", popup "No;Yes"
	DoPrompt "Add Drop Line", includeArrow
	includeArrow -= 1				// 0=No, 1=Yes

	Variable xCursorPositon = hcsr(A)
	Variable yCursorPosition = vcsr(A)

	GetAxis/Q left
	Variable axisYPosition = V_min

	SetDrawEnv xcoord=bottom, ycoord=left
	if (includeArrow)
		SetDrawEnv arrow=1, arrowlen=8, arrowfat=0.5
	else
		SetDrawEnv arrow=0
	endif
	DrawLine xCursorPositon, yCursorPosition, xCursorPositon, axisYPosition
End