Data Folders
Using data folders, you can store your data within an experiment in a hierarchical manner. Hierarchical storage is useful when you have multiple sets of similar data. By storing each set in its own data folder, you organize your data in a meaningful way and also avoid name conflicts.
Data folders can contain four kinds of data objects:
-
Waves
-
Numeric variables
-
String variables
-
Other data folders
Igor's data folders are very similar to a computer's hierarchical disk file system except they reside wholly in memory and not on disk. This similarity can help you understand the concept of data folders but you should take care not to confuse them with the computer's folders and files.
Data folders are particularly useful when you conduct several runs of an experiment. You can store the data for each run in a separate data folder. The data folders can have names like "run1", "run2", etc., but the names of the waves and variables in each data folder can be the same as in the others. In other words, the run information is encoded in the data folder name, allowing the data objects themselves to have the same names for all runs. Use this to write procedures that use the same wave and variable names regardless of which run they are working on.
Data folders are very handy for programmers who need to store private data between one invocation of their procedures and the next. This use of data folders is discussed under Managing Package Data.
The Data Browser window allows you to examine the data folder hierarchy. You display it by choosing Data→Data Browser.
One data folder is designated as the "current" data folder. Commands that do not explicitly target a particular data folder operate on the current data folder. You can see and set the current data folder using the Data Browser or using the GetDataFolder and GetDataFolderDFR functions and the SetDataFolder operation.
You can use the Data Browser not only to see the hierarchy and set the current data folder but also to:
-
Create new data folders.
-
Move, duplicate, rename and delete objects.
-
Browse other Igor experiment files and load data from them into memory.
-
Save a copy of data in the current experiment to an experiment file or folder on disk.
-
See and edit the contents of variables, strings, and waves in the information pane by selecting an object
-
See a simple plot of 1D or 2D waves by selecting one wave at a time in the main list while the plot pane is visible.
-
See a simple plot of a wave while browsing other Igor experiments.
-
See variable, string and wave contents by double-clicking on their icons.
-
See a simple histogram or wave statistics for one wave at a time.
A similar browser is used for wave selection in dialogs. For details see Dialog Wave Browser.
Before using data folders, be sure to read Using Data Folders.
Programmers should read Programming with Data Folders.
Data Folder Syntax
Data folders are named objects like other Igor objects such as waves and variables. Data folder names follow the same rules as wave names. See Liberal Object Names.
Igor Pro's data folders use the colon character ( : ) to separate components of a path to an object.
A data folder named "root" always exists and contains all other data folders.
A given object can be specified in a command using:
-
A full path
-
A partial path
-
Just the object name
The object name alone can only be used when the object is contained in the current data folder.
A full path starts with "root" and does not depend on the current data folder. A partial path starts with ":" and is relative to the current data folder.
Assume the following data folder structure:
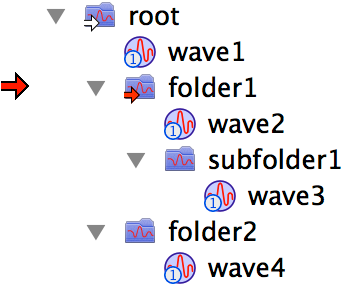
Assume also that the current data folder is folder1 (marked with the → symbol). The following are all valid Display commands:
Display wave2
Display :subfolder1:wave3
Display root:folder1:subfolder1:wave3
Display ::folder2:wave4
The last example illustrates a new rule: You can use multiple colons to walk back up the hierarchy. Here is another valid, though silly, example:
Display root:folder1:subfolder1:::folder2:wave4
Occasionally you need to specify a data folder itself rather than an object in a data folder. In that case, just leave off the object name. The path specification should therefore have a trailing colon. However, Igor will generally understand what you mean if you omit the trailing colon.
If you need to specify the current data folder, you can use just a single colon. For example:
KillDataFolder :
kills the current data folder, and all its contents, and then sets the current data folder to the parent of the current. Non-programmers might prefer to use the Data Browser to delete data folders.
Recall that the $ operator converts a string expression into a single name (see String Substitution Using $). Since data folders are named, the following is valid:
String df1 = "folder1", df2="subfolder1"
Display root:$(df1):$(df2):wave3
This is a silly example but would be useful if df1 and df2 were parameters to a procedure.
Note that parentheses must be used in this type of statement. That is a result of the precedence of $ relative to :.
When used at the beginning of a path, the $ operator works in a special way and must be used on the entire path:
String path1 = "root:folder1:subfolder1:wave3"
Display $path1
When liberal names are used within a path, they must be in single quotes. For example:
Display root:folder1:'subfolder 1':'wave 3'
String path1 = "root:folder1:'subfolder 1':'wave 3'"
Display $path1
However, when a simple name is passed in a string, single quotes must not be used:
Make 'wave 1'
String name
name = "'wave 1'"		// Wrong.
name = "wave 1"			// Correct.
Display $name
Data Folder Operations and Functions
Most people will use the Data Browser to create, view and manipulate data folders. The following operations will be mainly used by programmers, who should read Programming with Data Folders.
NewDataFolder path
SetDataFolder path
KillDataFolder path
DuplicateDataFolder srcPath, destPath
MoveDataFolder srcPath, destPath
MoveString srcPath, destPath
MoveVariable srcPath, destPath
MoveWave wave, srcPath [newname ]
RenameDataFolder path, newName
The following are functions that are used with data folders:
GetDataFolder(mode [, dfr ] )
CountObjects(pathStr, objtype )
GetIndexedObjName(pathStr, type, index )
GetWavesDataFolder(wave, mode )
DataFolderDir(mode )
DataFolderExists(pathStr )
Data Folders Reference Functions
Programmers can utilize data folder references in place of paths. Data folder references are lightweight objects that refer directly to a data folder whereas a path, consisting of a sequence of names, has to be looked up in order to find the actual target folder.
Here are functions that work with data folder references:
GetDataFolder(mode [, dfr ] )
GetIndexedObjNameDFR(dfr, type, index )
GetWavesDataFolderDFR(wave )
CountObjectsDFR(dfr, type )
DataFolderRefChanges(dfr, changeType )
DataFolderRefStatus(dfr )
DataFolderRefsEqual(dfr1, dfr2 )
For information on programming with data folder references, see Data Folder References.
Data Folders and Commands
Igor normally evaluates commands in the context of the current data folder. This means that, unless qualified with a path to a particular data folder, object names refer to objects in the current data folder. For example:
Function Test()
	Make wave1
	Variable/G myGlobalVariable
End
This function creates wave1 and myGlobalVariable in the current data folder. Likewise executing:
WaveStats wave1
operations on wave1 in the current data folder.
Data Folders and User-Defined Functions
To access global variables and waves from a user-defined function, you must first create an NVAR, SVAR or WAVE reference. These references are local objects that point to global objects. See Accessing Global Variables And Waves for details.
Data Folders and Window Recreation Macros
Window recreation macros begin with the Window keyword. They are used to recreate graphs, tables, and other Igor windows and are explained under Saving a Window as a Recreation Macro.
Window recreation macros are evaluated in the context of the root data folder. In effect, Igor sets the current data folder to root when the window macro starts and restores it when the window macro ends.
Macros that begin with the Macro or Proc keywords evaluate their commands in the context of the current data folder.
Evaluating window recreation macros this way ensures that a window is recreated correctly regardless of the current data folder, and provides some compatibility with window macros created with prior versions of Igor Pro which didn't have data folders.
This means that object names within window recreation macros that don't explicitly contain a data folder path refer to objects in the root data folder.
Data Folders and Assignment Statements
Wave and variable assignment statements are evaluated in the context of the data folder containing the wave or variable on the left-hand side of the statement:
root:subfolder:wave0 = wave1 + var1
is a shorter way of writing the equivalent:
root:subfolder:wave0 = root:subfolder:wave1 + root:subfolder:var1
This rule also applies to dependency formulae which use := instead of = as the assignment operator.
Data Folders and Controls
ValDisplay controls evaluate their value expression in the context of the root data folder.
SetVariable controls remember the data folder in which the controlled global variable exists, and continue to function properly when the current data folder is different from the controlled variable.
See Controls and Control Panels for details about controls.
Data Folders and Traces
You cannot tell by looking at a trace in a graph which data folder it resides in.
The easiest way to find out what data folder a trace's wave resides in is to use the trace info help. Choose Graph→Show Trace Info Tags and then hover the mouse over the trace to get trace info.
Another method is to use the Modify Trace Appearance dialog. Double-click the trace to display the dialog. The Traces list in the dialog shows the full data folder path for each trace.
Finally, you can create and examine the graph window recreation macro. See Saving a Window as a Recreation Macro for details.
Using Data Folders
You can use data folders for many purposes. Here are two common uses of data folders.
Hiding Waves, Strings, and Variables
Sophisticated Igor procedures may need a large number of global variables, strings and waves that aren't intended to be directly accessed by the user. The programmer who creates these procedures should keep all such items within data folders they create with unique names designed not to conflict with other data folder names.
Users of these procedures should leave the current data folder set to the data folder where their raw data and final results are kept, so that the procedure's globals and waves won't clutter up the dialog lists.
Programmers creating procedures should read Managing Package Data.
Separating Similar Data
One situation that arises during repeated testing is needing to keep the data from each test run separate from the others. Often the data from each run is very similar to the other runs, and may even have the same name. Without data folders you would need to choose new names after the first run.
By making one data folder for each test run, you can put all of the related data for one run into each folder. The data can use identical names, because other identically named data is in different data folders.
Using data folders also keeps the data from various runs from being accidently combined, since only the data in the current data folder shows up in the various dialogs or can be used in a command without a data folder name.
The WaveMetrics-supplied "Multipeak Fitting" example experiment's procedures work this way: they create data folders to hold separate peak curve fit runs and global state information.
Using Data Folders Example
This example will use data folders to:
-
Load data from two test runs into separate data folders
-
Create graphs showing each test run by itself
-
Create a graph comparing the two test runs
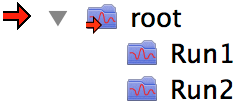
First we'll use the Data Browser to create a data folder for each test run.
Open the Data Browser, and set the current data folder to root by right-clicking the root icon and choosing Set as Current Data Folder.
Click the root data folder, and click the New Data Folder button. Enter "Run1" for the new data folder's name and click OK.
Click New Data Folder again. Enter "Run2" for the new data folder's name and click OK.
The Data Browser window should look like this:
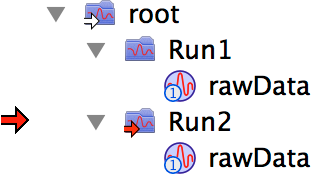
Now let's load sample data into each data folder, starting with Run1.
Set the current data folder to Run1, then choose Data→Load Waves→Load Delimited Text. Select the CSTATIN.ASH file from the Sample Data subfolder of the Learning Aids folder, and click Open. In the resulting Loading Delimited Text dialog, name the loaded wave "rawData" and click Load. We will pretend this data is the result of Run 1. Type "Display rawData" on the command line to graph the data.
Set the current data folder to Run2, and repeat the wave loading steps, selecting the CSTATIN.ASV file instead. In the resulting Loading Delimited Text dialog, name the loaded wave "rawData". We will pretend this data is the result of Run 2. Repeat the "Display rawData" command to make a graph of this data.
Notice that we used the same name for the loaded data. No conflict exists because the other rawData wave is in another data folder.
In the Data Browser, set the current data folder to root.
In the Data Browser, uncheck the Variables and Strings checkboxes in the Display section. Open the Run1 and Run2 icons by clicking the disclosure icons next to them. At this point, the Data Browser should look something like this:
You can easily make a graph displaying both rawData waves to compare them better. Choose Windows→New Graph to display the New Graph dialog. Use the dialog wave browser controls (see Dialog Wave Browser) to select both root:Run1:rawData and root:Run2:rawData. Click Do It.
You can change the current data folder to anything you want and the graphs will continue to display the same data. Graphs remember which data folder the waves belong to, and so do graph recreation macros. This is often what you want, but not always.
Suppose you have many test runs in your experiment, each safely tucked away in its own data folder, and you want to "visit" each test run by looking at the data using a single graph which displays data from the test run's data folder only. When you visit another test run, you want the graph to display data from that other data folder only.
Additionally, suppose you want the graph characteristics to be the same (the same axis labels, annotations, line styles and colors, etc.). You could:
-
Create a graph for the first test run
-
Kill the window, and save the graph window macro.
-
Edit the recreation macro to reference data in another data folder.
-
Run the edited recreation macro.
The recreated graph will have the same appearance, but use the data from the other data folder. The editing usually involves changing a command like:
SetDataFolder root:Run1:
to:
SetDataFolder root:Run2:
If the graph displays waves from more than one data folder, you may need to edit commands like:
Display rawData,::Run1:rawData
as well.
However, there is another way that doesn't require you to edit recreation macros: use the ReplaceWave operation to replace waves in the graph with waves from the other folder. To do this:
-
Set the current data folder to the one containing the waves you want to view
-
Activate the desired graph
-
Execute in the command line:
ReplaceWave allinCDF
This replaces all the waves in the graph with identically named waves from the current data folder, if they exist. See the ReplaceWave operation for details. You can choose Graph→Replace Wave to display a dialog in which you can generate ReplaceWave commands interactively.
Though we have only one wave per data folder, we can try it out:
-
Set the current data folder to Run1.
-
Select the graph showing data from Run2 only (CSTATIN.ASV).
-
Type in the command line:
ReplaceWave allinCDF
The graph is updated to show the rawData wave from Run1.
For another example of using Data Folders, choose File→Example Experiments→Tutorials→Data Folder Tutorial.
The Data Browser
The Data Browser lets you navigate through the data folder hierarchy, examine properties of waves and values of numeric and string variables, load data objects from other Igor experiments, and save a copy of data from the current experiment to an experiment file or folder on disk.
To open the browser choose Data Browser from the Data menu.
The user interface of the Data Browser is similar to that of the computer desktop. The basic Igor data objects (variables, strings, waves and data folders) are represented by icons and arranged in the main list based on their hierarchy in the current experiment. The browser also sports several buttons that provide the user with additional functionality.
The main components of the Data Browser window are:
-
The main list which displays icons representing data folders, waves, and variables
-
The Display checkboxes which control the types of objects displayed in the main list
-
The buttons for manipulating the data hierarchy
-
The info pane which displays information about the selected item
-
The plot pane which displays a graphical representation of the selected wave
The Main List
The main list occupies most of the Data Browser when it is first invoked.
At the top of the data tree is the root data folder which by default appears expanded. By double-clicking a data folder icon you can change the display so that the tree is displayed with your selection as the top data folder instead of root. You can use the pop-up menu above the main list to change the current top data folder to another data folder in the hierarchy.
Following the top data folder are all the data objects that it contains. Objects are grouped by type and by default are listed in creation order. You can change the sort order using the gear icon. You can filter the list using the filter textbox.
You can select data objects with the mouse. You can select multiple contiguous data objects by shift-clicking. You can select multiple discontiguous data objects by Ctrl-clicking.
Objects remain selected even when they are hidden inside collapsed data folders. If you select a wave, collapse its data folder, Shift-select another wave, and drag it to another data folder, both waves will be moved there. However, when a selected object is hidden by deselecting the relevant Display checkbox, actions, such as deletion and duplication, are not taken upon it.
You can rename data objects by clicking the name of the object and editing the name.
The Data Browser also supports icon dragging to move or copy data objects from one data folder to another. You can move data objects from one data folder to another by dragging them. You can copy data objects from one data folder to another by pressing Alt while dragging.
You can duplicate data objects within a data folder by choosing Duplicate from the Edit menu or by pressing Ctrl+D.
You can copy the full paths of all selected data objects, quoted if necessary, to the command line by dragging the objects onto the command line.
You can select one or more waves in the list and drag them into an existing graph or table window to append them to the target window. See Appending Traces by Drag and Drop for details.
The Current Data Folder
The "current data folder" is the data folder that Igor uses by default for storing newly-created variables, strings, waves and other data folders. Commands that create or access data objects operate in the current data folder unless you use data folder paths to specify other data folders.
Above the main list there is a textbox that shows the full path to the current data folder. The main list displays a red arrow overlayed on the icon of the current data folder. When the current data folder is contained inside another data folder, a white arrow indicator is overlayed on the icons of the ancestors of the current data folder.
To set the current data folder, right-click any data folder and select Set Current Data Folder. You can also set the current data folder by dragging the red arrow or by Alt-clicking a data folder icon.
Display Checkboxes
The Display checkbox group lets you control which object types are shown in the main list. Data folders are always shown. They also allow you to show or hide the info pane and the plot pane.
The Info Pane
To view the info pane, check the Info checkbox.
The info pane appears below the main list. When you select an object in the main list, its properties or contents appear in the info pane. For example, when you select a variable, its name and value are displayed in the info pane.
If you select a wave in the main list, the info pane displays various properties of the wave, such as type, size, dimensions, units, start X, delta X and note. Each of these fields is displayed as a blue label followed by a plain text value. You can control which properties are displayed using the Data Browser category of the Miscellaneous Settings dialog.
If you select a data folder, the info pane may display notes for the data folder. See Data Folder Notes for details.
You can edit the name and value of a numeric or string variable, or the name and properties of a wave, by clicking the Edit Object Properties button at the top right corner of the info pane. The button appears only when a single object is selected. Clicking it displays the Edit Object Properties dialog.
The info pane can also display statistics for any selected wave. To show wave statistics, click the sigma icon at the top of the info pane. To change back to normal mode, click the i icon.
You can copy the text displayed in the info pane to the clipboard by clicking the clipboard button at the top of the info pane.
You can control various aspects of the info pane display by right-clicking and choosing an item from the Settings submenu. The options include how white space is displayed, parenthesis matching, syntax coloring, and word wrap.
The Plot Pane
To view the plot pane, check the Plot checkbox.
The plot pane provides a graphical display of a single selected wave. The plot pane is situated below the main list and the info pane. It displays a small graph or image of a wave selected in the main list above it. The plot pane does not display text waves or more than one wave at a time.
You can control various properties of the plot pane by right-clicking and using the resulting pop-up menu.
You can toggle the display of axes by choosing Show Axes from the pop-up menu. You can also toggle between showing a plot of the selected wave and a plot of a 1D histogram by choosing Show Plot or Show Histogram.
Simple 1D real waves are drawn in red on a white background. Complex 1D waves are drawn as two traces with the real part drawn in red and the imaginary in blue. The mode, line style, line size, marker, marker size, and color of the trace can all be configured using the pop-up menu.
2D waves are displayed as an image that by default is scaled to the size of the plot pane and uses the Rainbow color table by default. You can change the aspect ratio and color table via the pop-up menu.
By default, images are displayed with the left axis reversed - that is, the Y value increases from top to bottom, consistent with the behavior of the NewImage operation. You can disable this by choosing Reverse Left Axis from the pop-up menu.
When you select a 3D or 4D wave in the main list, the plot pane displays one layer of the wave at a time. Controls at the top of the plot pane allow you to choose which layer is displayed. You can start the plot pane cycling through the layers using the play button and stop it using the stop button.
If the dimensionality of the selected wave is such that it could be interpreted as containing RGB or RGBA data, Igor displays the Automatically Detect RGB(A) checkbox. If you check it, Igor displays the data as an RGB(A) composite image. Otherwise the image data is displayed using a color table, just as with 2D data.
The New Data Folder Button
The New Data Folder button creates a new data folder inside the current data folder. The Data Browser displays a simple dialog to ask for the name of the new data folder and tests that the name provided is valid. When entering liberal object names in the dialog, do not use single quotes around the name.
The Browse Expt Button
The Browse Expt button loads data objects from an Igor packed experiment file or from a folder on disk into the current experiment.
To browse a packed experiment file, click Browse Expt. The Data Browser displays the Open File dialog from which you choose the packed experiment file to browse.
To browse a folder on disk, which may contain packed experiment files, standalone Igor wave (.ibw) files, and other folders, press Alt while clicking Browse Expt. The Data Browser displays the Choose Folder dialog from which you choose the folder to browse.
Once you select the packed experiment file or the folder to browse, the Data Browser displays an additional list to the right of the main list. The righthand list displays icons representing the data in the file or folder that you selected for browsing. To load data into the current experiment, select icons in the righthand list and drag them into a data folder in the lefthand list.
Click the Done Browsing button to close the righthand list and return to normal operating mode.
The Save Copy Button
The Save Copy button copies data objects from the current experiment to an Igor packed experiment file on disk or as individual files to a folder on disk. Most users will not need to do this because the data is saved when the current experiment is saved.
Before clicking Save Copy, select the items that you want to save. When you click Save Copy, the Data Browser presents a dialog in which you specify the name and location of the packed Igor experiment file which will contain a copy of the saved data.
If you press Alt while clicking Save Copy, the Data Browser presents a dialog for choosing a folder on disk in which to save the data in unpacked format. The unpacked format is intended for advanced users with specialized applications.
When saving as unpacked, the Data Browser uses "mix-in" mode. This means that the items saved are written to the choosen disk folder but pre-existing items on disk are not affected unless they conflict with items being saved in which case they are overwritten.
When saving as unpacked, if you select a data folder in the Data Browser, it and all of its contents are written to disk. The name of the disk folder is the same as the name of the selected data folder except for the root data folder which is written with the name Data. If you don't select a data folder but just select some items, such as a few waves, the Data Browser writes files for those items but does not create a disk folder.
By default, objects are written to the output without regard to the state of the Waves, Variables and Strings checkboxes in the Display section of the Data Browser. However, there is a preference that changes this behavior in the Data Browser category of the Miscellaneous Settings dialog. If you check the 'Save Copy saves ONLY displayed object types' checkbox, then Save Copy writes a particular type of object only if the corresponding Display checkbox is checked.
The Data Browser does not provide a method for adding or deleting data to or from a packed experiment file on disk. It can only overwrite an existing file. To add or delete, you need to open the experiment, make additions and deletions and then save the experiment.
The Delete Button
The Delete button is enabled whenever data objects are selected in the main list. If you click it, the Data Browser displays a warning listing the number of items that will be deleted.
To skip the warning, press Alt when clicking in the Delete button.
Use this skip feature with great care. If you accidentally delete something, you cannot undo it except by reverting the entire experiment to its last saved state.
Clicking the Delete button when the root data folder is selected deletes all data objects in the current experiment.
If you accidentally delete something, you cannot undo it except by reverting the entire experiment to its last saved state.
If you try to delete an object that cannot be deleted, such as a wave used in a graph or table, Igor displays a warning message that some objects could not be deleted. Click the Show Details button in this dialog to get a list of objects that were not deleted.
The Execute Cmd Button
The Execute Cmd button provides a shortcut for executing a command on selected items in the Data Browser window. When you click the Execute Cmd button, Igor displays a dialog in which you can specify the command to be executed and the execution mode. Once you have set the command, you can skip the dialog and just execute the command by pressing Alt while clicking the button.
The format of the command is the same as other Igor commands except that you use %s where the selection is to be inserted. For example:
Display %s
For the case where the command to be executed exceeds the maximum length for an Igor command, you can specify a secondary command. For example:
AppendToGraph %s
When 'Execute for each selected item' is enabled, Igor executes the primary command once for each selected item, substituting the full path to the item in place of %s. So, for example, if you select wave0, wave1 and wave2 in the root data folder, Igor executes:
Display root:wave0
Display root:wave1
Display root:wave2
When 'Execute once for all selected items' is enabled, Igor executes the primary command once, like this:
Display root:wave0, root:wave1, root:wave2
If the command would exceed the maximum length of the command line, Igor executes the primary and secondary commands, like this:
Display root:wave0, root:wave1
AppendToGraph root:wave2
Data Browser Command String Limitations
The command strings set in the Execute Cmd dialog, as well as those set via the ModifyBrowser operation, must be shorter than the maximum command length of 2500 bytes and may not contain "printf", "sprintf" or "sscanf".
When executing the command on all selected objects at once, the primary and secondary command strings may contain at most one "%s" token.
The commands must not close the Data Browser window.
The command string mechanism is sometimes convenient but somewhat kludgy. It is cleaner and more transparent to get the list of selected object using the GetBrowserSelection function and then process the list using normal list-processing techniques.
Using the Find in Data Browser Dialog
If you choose the Edit→Find, the Data Browser displays the Find in Data Browser dialog. This dialog allows you to find waves, variables and data folders that might be buried in sub-data folders. It also provides a convenient way to select a number of items at one time, based on a search string. You can then use the Execute Cmd button to operate on the selection.
The Find in Data Browser dialog allows you to specify the text used for name matching. Any object whose name contains the specified text is considered a match.
You can also use the wildcard character "*" to match zero or more characters regardless of what they are. For example, "w*3" matches "wave3", and "w3", ""
The dialog also allows you to specify whether the search should be case sensitive, use whole word matching, and wrap around.
Data Browser Pop-Up Menu
You can apply various Igor operations to objects by selecting the objects in the Data Browser, right-clicking, and choosing the operation from the resulting pop-up menu.
Using the Display and New Image pop-up items, you can create a new graph or image plot of the selected wave. You can select multiple waves, in the same or different data folders, to display together in the same graph.
The Copy Full Path item copies the complete data folder paths of the selected objects, quoted if necessary, to the clipboard.
The Show Where Object Is Used item displays a dialog that lists the dependencies in which the selected object is used and, for waves, the windows in which the wave is used. This item is available only when just one data object is selected.
The Adopt Wave item adopts a shared wave into the current experiment.
Data Browser Preferences
Various Data Browser settings are controlled from the Data Browser category of the Miscellaneous Settings dialog. You access them by choosing Misc→Miscellaneous Settings and clicking Data Browser in the lefthand list.
Programming the Data Browser
The Data Browser can be controlled from Igor procedures using the following operations and functions:
CreateBrowser, ModifyBrowser, GetBrowserSelection, GetBrowserLine
Advanced Igor programmers can use the Data Browser as an input device via the GetBrowserSelection function. For an example, choose File→Example Experiments→Tutorials→Data Folder Tutorial.
Using the Data Browser as a Modal Dialog
You can use the Data Browser as a modal dialog to let the user interactively choose one or more objects to be processed by a procedure. The modal Data Browser is separate from the regular Data Browser that you invoke by choosing Data→Data Browser. The modal Data Browser normally exists only briefly, while you solicit user input from a procedure.
There are two methods for creating and displaying the modal Data Browser. Examples are provided in the help for the CreateBrowser operation.
The first and simplest method is to use the CreateBrowser operation with the prompt keyword. You can optionally use any of the other keywords supported by CreateBrowser.
The second method is to use the CreateBrowser operation with the /M flag. This creates the modal Data Browser but does not display it. You then call ModifyBrowser with the /M flag to configure the modal browser as you like. When you are ready to display the browser, call ModifyBrowser with the /M flag and the showModalBrowser keyword.
Using either method, when the user clicks OK or Cancel or closes the modal browser using the close box, the browser sets the V_Flag and S_BrowserList variables. If the user clicks OK, V_Flag is set to 1 and S_BrowserList is set to contain a semicolon-separated list of the full paths of the selected items. If the user clicks Cancel or the close box, V_Flag is set to 0 and S_BrowserList is set to "".
The Data Browser stores full paths, quoted if necessary, in S_BrowserList. Each full path is followed by a semicolon. You can extract the full paths one-by-one using the StringFromList function.
The output variables are local when CreateBrowser is executed from a procedure. There is no reason for you to create the modal Data Browser from the command line, but if you do, the output variables are global and are created in the current data folder at the time the CreateBrowser operation was invoked.
The user can change the current data folder in the modal browser. In most cases this is not desirable. The examples for the CreateBrowser operation show how to save and restore the current data folder.
When the user clicks the OK button, the Data Browser executes the commands that you specify using the command1 and command2 keywords to CreateBrowser or ModifyBrowser. If you omit these keywords, it does not execute any commands.
Managing Data Browser User-Defined Buttons
User-defined buttons allow you to customize your work environment and provide quick access to frequently-used operations. You add a button using ModifyBrowser appendUserButton and delete a button using ModifyBrowser deleteUserButton. The appendUserButton keyword allows you to specify the button name as well as the command to be executed when the button is clicked.
The user button command allows you to invoke operations or functions on the objects that are currently selected in the Data Browser or to invoke some action that is completely unrelated to the selection. For example, the command string "Display %s" will display each of the currently selected waves while the command string "Print IgorInfo(0)" prints some general information in the history window.
When you click a user button, the command is executed once for each selected item if the command string contains a %s. Otherwise the command is executed once regardless of the current selection. If you want to operate once on the whole selection you must not use %s but instead call GetBrowserSelection from your function.
User buttons are drawn in the order that they are appended to the window. If you want to change their position you must delete them and then append them in the desired order.
Buttons are not saved with the experiment or in preferences so they must be added to the Data Browser when Igor starts. To add a set of buttons so that they are available in any experiment you must write an IgorStartOrNewHook hook function. See User-Defined Hook Functions for more information.
Data Folder Notes
You can store notes describing a particular data folder in a string variable in that data folder and view those notes in the Data Browser.
When a single data folder is selected in the Data Browser and the info pane is visible, if the data folder contains a string whose name matches a preset list, the contents of the string are displayed in the info pane. You can edit the list of string names in the Info Pane tab of the Data Browser category of the Miscellaneous Settings dialog. The default list of names is "readme;notes;".
For example, execute the following commands on the command line:
NewDataFolder/O TestDF
String root:TestDF:readme = "This is a data folder note"
Now open the Data Browser, make sure the Info Pane checkbox is checked, and select TestDF in the main list. The contents of root:TestDF:readme are displayed in the info pane.
If a data folder contains more than one string matching the list of string names to use as data folder notes, only the first matching string in the list is used.
This feature was added in Igor Pro 9.00. To disable it, set the list of names in the Miscellaneous Settings dialog to an empty string.