Debugging
There are two techiques for debugging procedures in Igor:
-
Using print statements
-
Using the symbolic debugger
For most situations, the symbolic debugger is the most effective tool. In some cases, a strategically placed print statement is sufficient.
Debugging With Print Statements
This technique involves putting print statements at a certain point in a procedure to display debugging messages in Igor's history area. In this example, we use Printf to display the value of parameters to a function and then Print to display the function result.
Function Test(w, num, str)
	WAVE w
	Variable num
	String str

	Printf "Wave=%s, num=%g, str=%s\r", NameOfWave(w), num, str

	<body of function>

	Print result
	return result
End
See Creating Formatted Text for details on the Printf operation.
The Debugger
When a procedure doesn't produce the results you want, you can use Igor's built-in debugger to observe the execution of macros and user-defined functions while stepping through the lines of code.
The debugger is normally disabled. Select Enable Debugger in either the Procedure menu or the contextual menu shown, by right-clicking in any procedure window.
Igor displays the debugger window when one of the following events occurs:
-
A breakpoint that you previously set is hit.
-
An error occurs, and you have enabled debugging on that kind of error.
-
An error dialog is presented, and you click the Debug button.
-
The Debugger command is executed.
The debugger cannot be used with threadsafe code unless it is running in the main thread. See Debugging ThreadSafe Code for details.
Setting Breakpoints
When you want to observe a particular routine in action, set a breakpoint on the line where you want the debugger to appear. To do this, open the procedure window which contains the routine, and click in the left "breakpoint margin". The breakpoint margin appears only if the debugger is enabled.
 | Debugger disabled | |
 | Debugger enabled | |
The red dot denotes a breakpoint that you have set.
When a line of code marked with a breakpoint is about to execute, Igor displays the debugger window.
Click the red dot again to clear the breakpoint. Right-click and use the pop-up menu to clear all breakpoints or disable a breakpoint on the currently selected line of the procedure window.
Debugging on Error
You can tell Igor to automatically open the debugger window when an error occurs. There are several categories of errors to choose from:
| Debug On Error | Any runtime error except failed NVAR, SVAR, or WAVE references. | |
| Debug On User Abort | The Abort button in the status bar is relabeled to "Debug", instead of "Abort". Click Debug to enter the debugger after the currently executing line finishes. | |
| NVAR SVAR WAVE Checking | Failed NVAR, SVAR, or WAVE references. | |
We recommend that Igor programmers turn all of these options on to get timely information about errors.
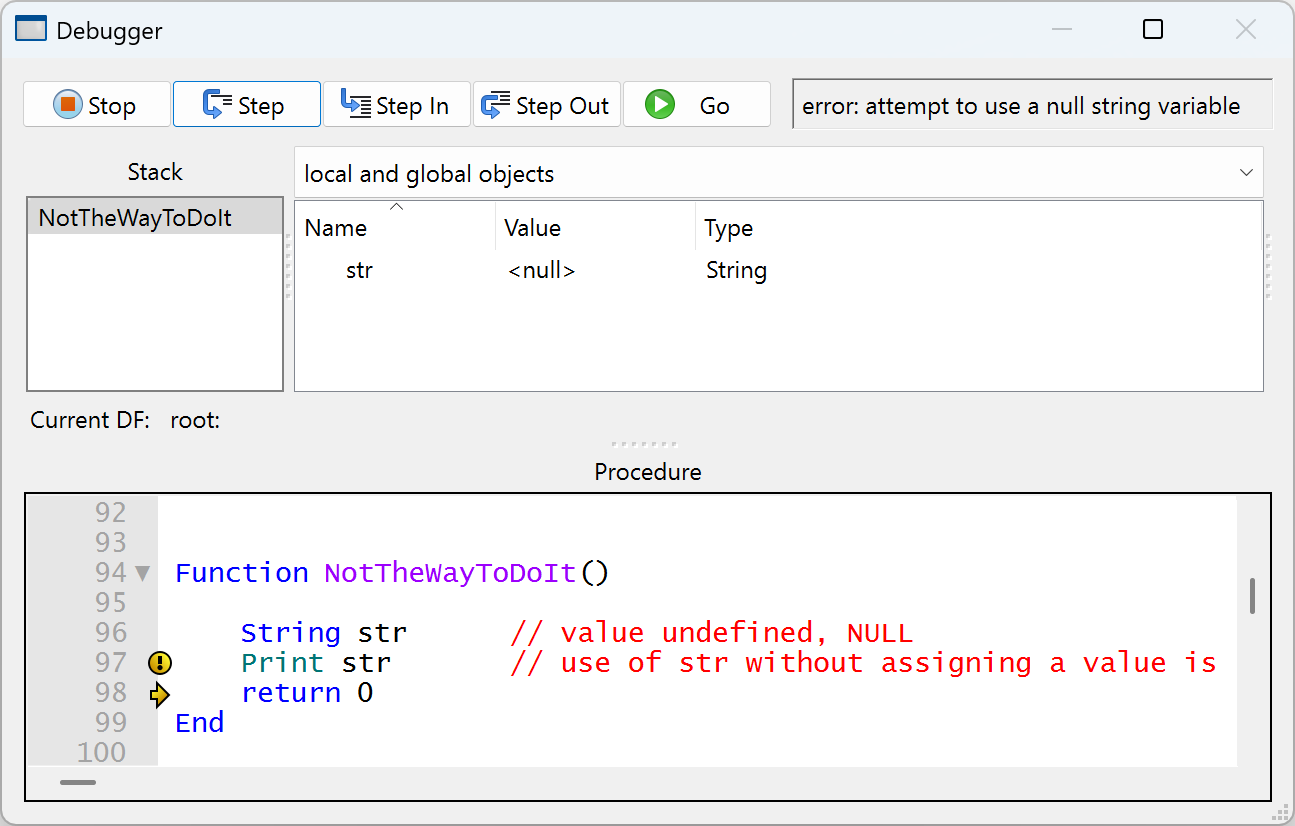
Use the Procedure or contextual menus to enable or disable these error categories. If the selected error occurs, Igor displays the debugger with an error message in its status area. The error message was generated by the command indicated by a round yellow icon, in this example the Print str command:
Writing Code to Avoid The Debugger
Sometimes you do something that you know may cause an error and you want to handle the error yourself, without breaking into the debugger. One such case is attempting to access a wave or variable that may or may not exist. You want to test its existence without breaking into the debugger.
You can use the /Z flag to prevent the Debug on Error feature from kicking in when an NVAR, SVAR, or WAVE reference fails. For example:
WAVE/Z w = <path to possibly missing wave>
if (WaveExists(w))
	<do something with w>
endif
In other cases where an error may occur and you want to handle it yourself, you need to temporarily disable the debugger and use GetRTError to get and clear the error. For example:
Function DemoDisablingDebugger()
	DebuggerOptions                             // Sets V_enable to 1 if debugger is enabled
	Variable debuggerEnabled=V_enable
	DebuggerOptions enable=0                    // Disable debugger

	String name = ";"                           // This is an illegal wave name
	Make/O $name                                // So this will generate an error

	DebuggerOptions enable=debuggerEnabled      // Restore debugger enable setting

	Variable err = GetRTError(1)                // Clear error
	if (err != 0)
		Printf "Error %d\r", err
	else
		Print "No error"
	endif
End
Debugging on User Abort
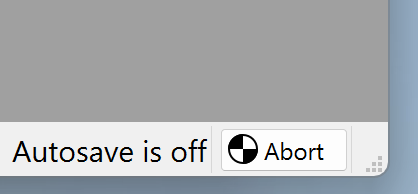
You can stop user code execution by pressing the Abort button in the lower right corner of Igor's MDI frame:
This is useful for stopping code that is taking much longer than expected. For example, you can abort a wave assignment statement that is taking a long time.
Normally the Abort button simply stops executing the user code and returns control to normal interactive operation. You will need to manually figure out what Igor was doing when the user aborted execution, perhaps by stepping through the code slowly using the debugger.
A more useful method for determining what the code is doing at the time is to enable Debug on User Abort. To enable or disable this feature, choose Procedure→Debug On User Abort or right-click in a procedure window and choose Debug On User Abort from the pop-up menu.
This tells Igor that instead of just stopping execution when you press the Abort button, instead automatically open the debugger window at the location of the executing code. It pauses execution and opens the debugger so you can see what was going on.
When Debug On User Abort is enabled, the Abort button in the status bar is labeled "Debug" instead of "Abort". Click Debug to enter the debugger after the currently executing line finishes.
To avoid entering the debugger when a command is half-finished, with Debug on User Abort enabled, when you click the Debug button, Igor waits for the current command to finish before breaking into the debugger. If a very lengthy operation or assignment statement is running, you may have to wait a long time for the debugger to activate.
You can interrupt the currently running command and enter the debugger more quickly using the User Abort Key Combinations instead of clicking the Debug button. This may enter the debugger at a time when an assignment is only partially finished.
Debug on User Abort does not affect programmed aborts using the Abort, AbortOnRTE, or AbortOnValue operations.
Some Igor code cannot be debugged. This includes most thread-safe function code, hidden code, and independent module code (but see SetIgorOption IndependentModuleDev=1). If you click the Debug button or use the Abort key combinations while running code that cannot be debugged, code execution is stopped just as if Debug on User Abort was not set. For example, this code:
ThreadSafe Function Mistake(Variable loopCount)
	// compute 2^loopCount (badly)
	Variable n=1/2
	do
		n *= 2
		// forgot to decrement loopCount
	while (loopCount > 0)
	return n
End
Function MultithreadedCaller()
	Make/O/N=10 outWave
	MultiThread outWave = Mistake(10)
	Print "back from threads"
End
cannot be easily debugged when MultithreadedCaller is called when Debug on User Abort is enabled.
Clicking the Debug button in the status bar tells Igor to defer aborting execution until the multithreaded code returns (which it won't in this example).
In that situation you must use the Abort key combinations (Shift+Escape or Ctrl+Break) to cease execution.
To debug this code, see Debugging Threadsafe Code.
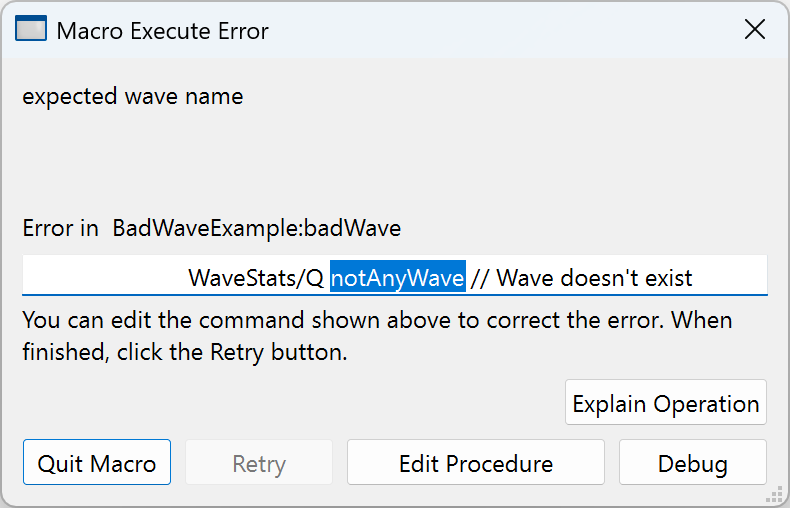
Macro Execute Error: The Debug Button
When the debugger is enabled and an error occurs in a macro, Igor presents an error dialog with, in most cases, a Debug button. Click the Debug button to open the debugger window.
Errors in macros and procs are reported immediately after they occur.
When an error occurs in a user-defined function, Igor normally displays an error dialog long after the error actually occurred. The Debug On Error option is for programmers and displays errors in functions when they occur by entering the debugger right after the error occurs.
Stepping Through Your Code
Single-stepping through code is useful when you are not sure what path it is taking or how variables wound up containing their values.
Begin by enabling the debugger and setting a breakpoint on the line of code you are interested in, or begin when the debugger automatically opens because of an error. Use the buttons at the top of the debugger window to step through your code:
The Stop Button
The Stop button ceases execution of the running function or macro before it completes. This is equivalent to clicking Igor's Abort button while the procedure is running. If you have enabled Debug on Abort, the Stop button still causes execution to cease.
Keyboard shortcut: Ctrl+Break
The Step Button
The Step (step over) button executes the next line. If that line contains a call to one or more subroutines, execution continues until the subroutines return or until an error or breakpoint is encountered. Upon return, execution halts until you click a different button.
Keyboard shortcuts: Enter, keypad Enter, Return or F10
The Step Into Button
The Step Into button executes the next line. If that line contains a call to one or more subroutines, execution halts when the first subroutine is entered. The Stack list of currently executing routines shows the most recently entered routine as the last item in the list.
Keyboard shortcuts: +, =, keyPad + or F11
The Step Out Button
The Step Out button executes until the current subroutine is exited, or an error or breakpoint is encountered.
Keyboard shortcuts: - (minus), _ (underscore), keypad - or Shift+F11
The Go Button
The Go button resumes program execution. The debugger window remains open until execution completes or an error or breakpoint is encountered.
If you press the Alt key while clicking the Go button, the debugger window is closed until execution completes or an error or breakpoint is encountered.
Keyboard shortcut: Esc or F5
The Stack and Objects Lists
The Stack List shows the routine that is currently executing and the chain of routines that called it. The top item in the list is the routine that began execution, and the bottom item is the routine which is currently executing.
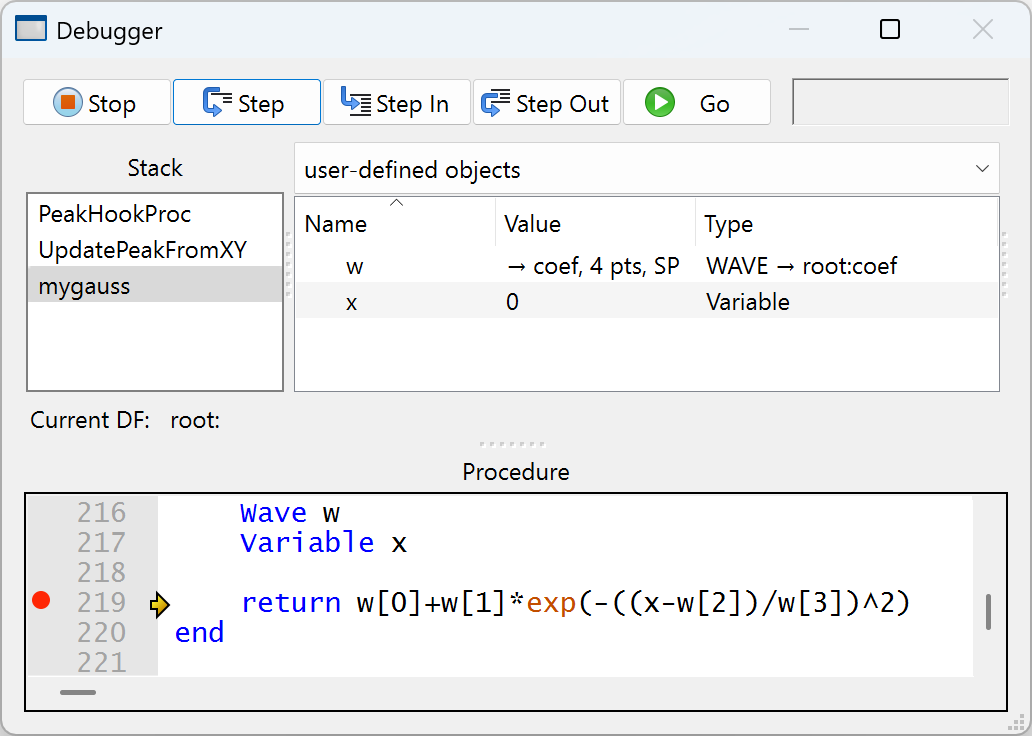
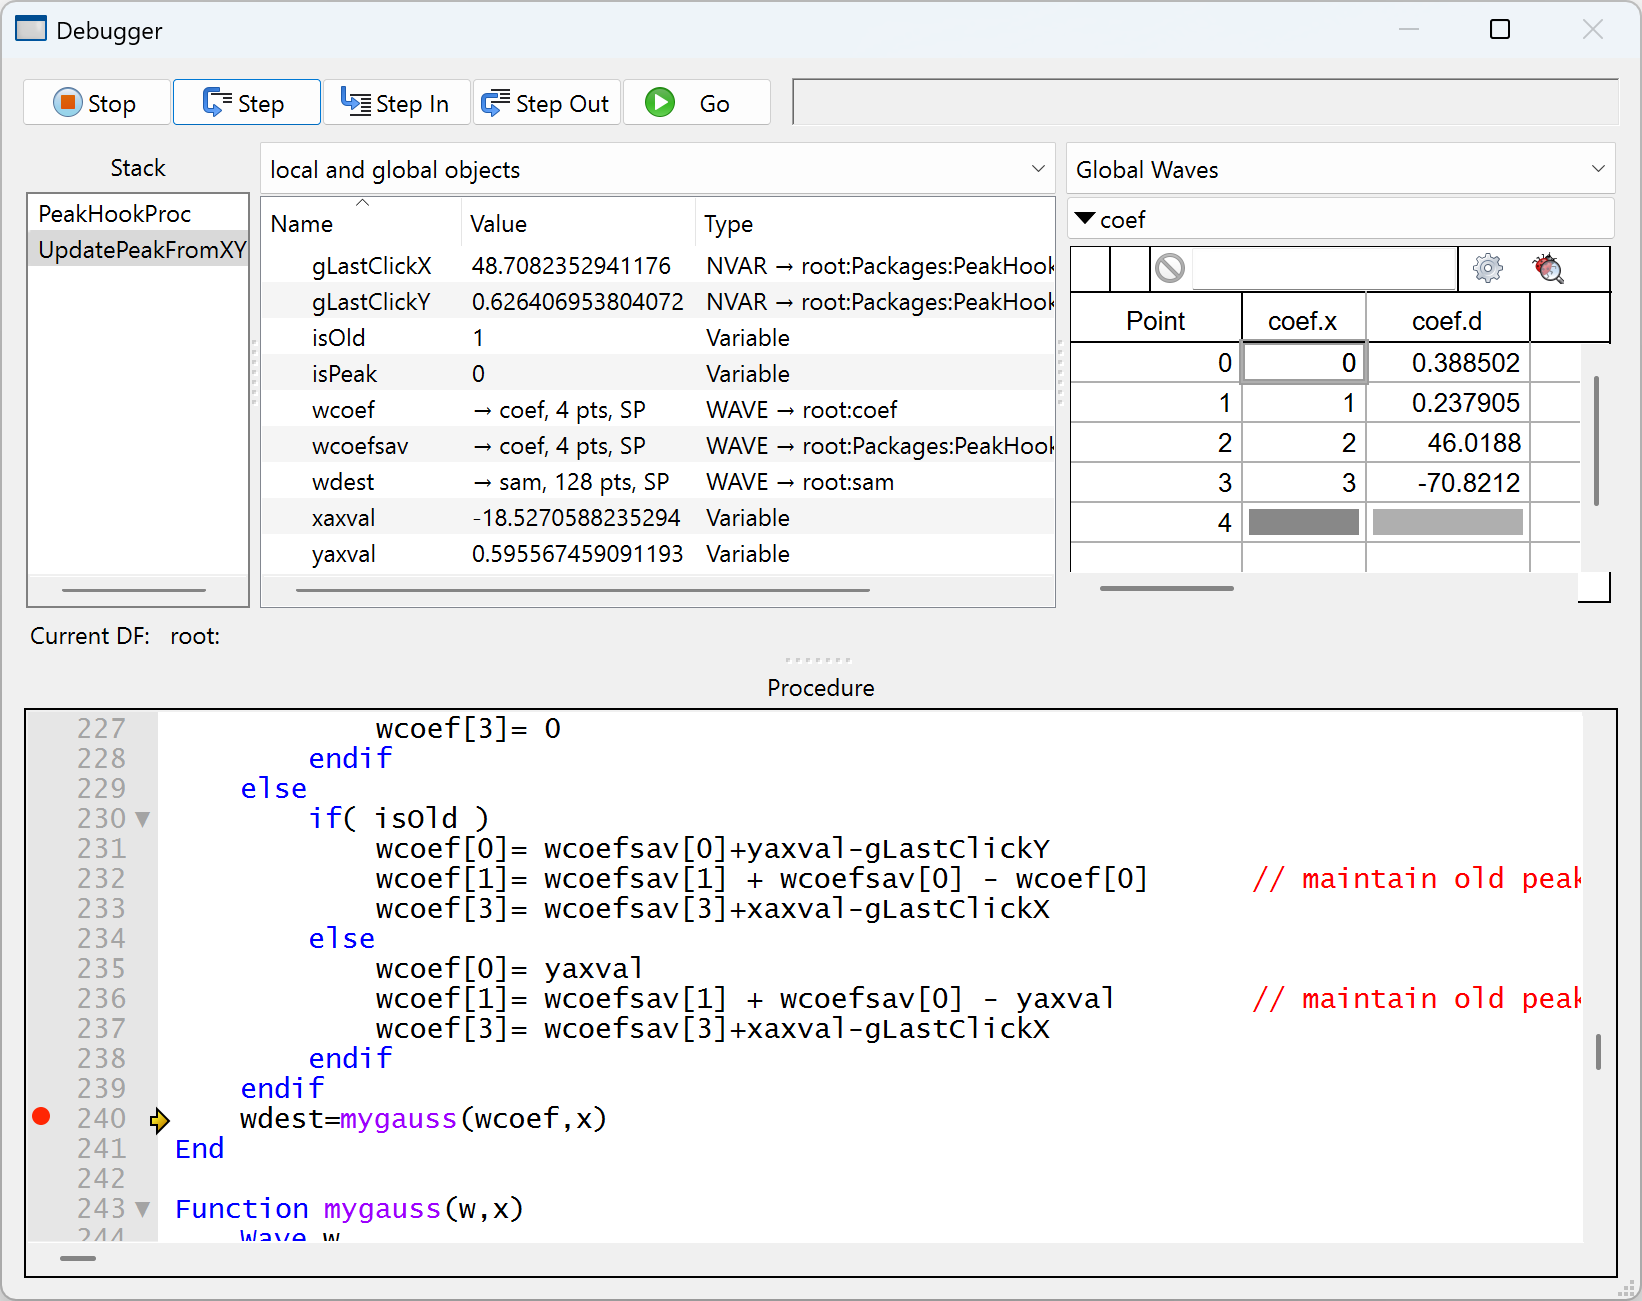
In this example, the routine that started execution is PeakHookProc, which most recently called UpdatePeakFromXY, which then called the currently executing mygauss user function.
The Objects List, to the right of the Stack List, shows that the function parameters w and x have the values coef (a wave) and 0 (a number). The pop-up menu controls which objects are displayed in the list; the example shows only user-defined local objects such as Variables, Strings, or WAVE references.
You can examine the objects associated with any routine in the Stack List by simply selecting the routine:
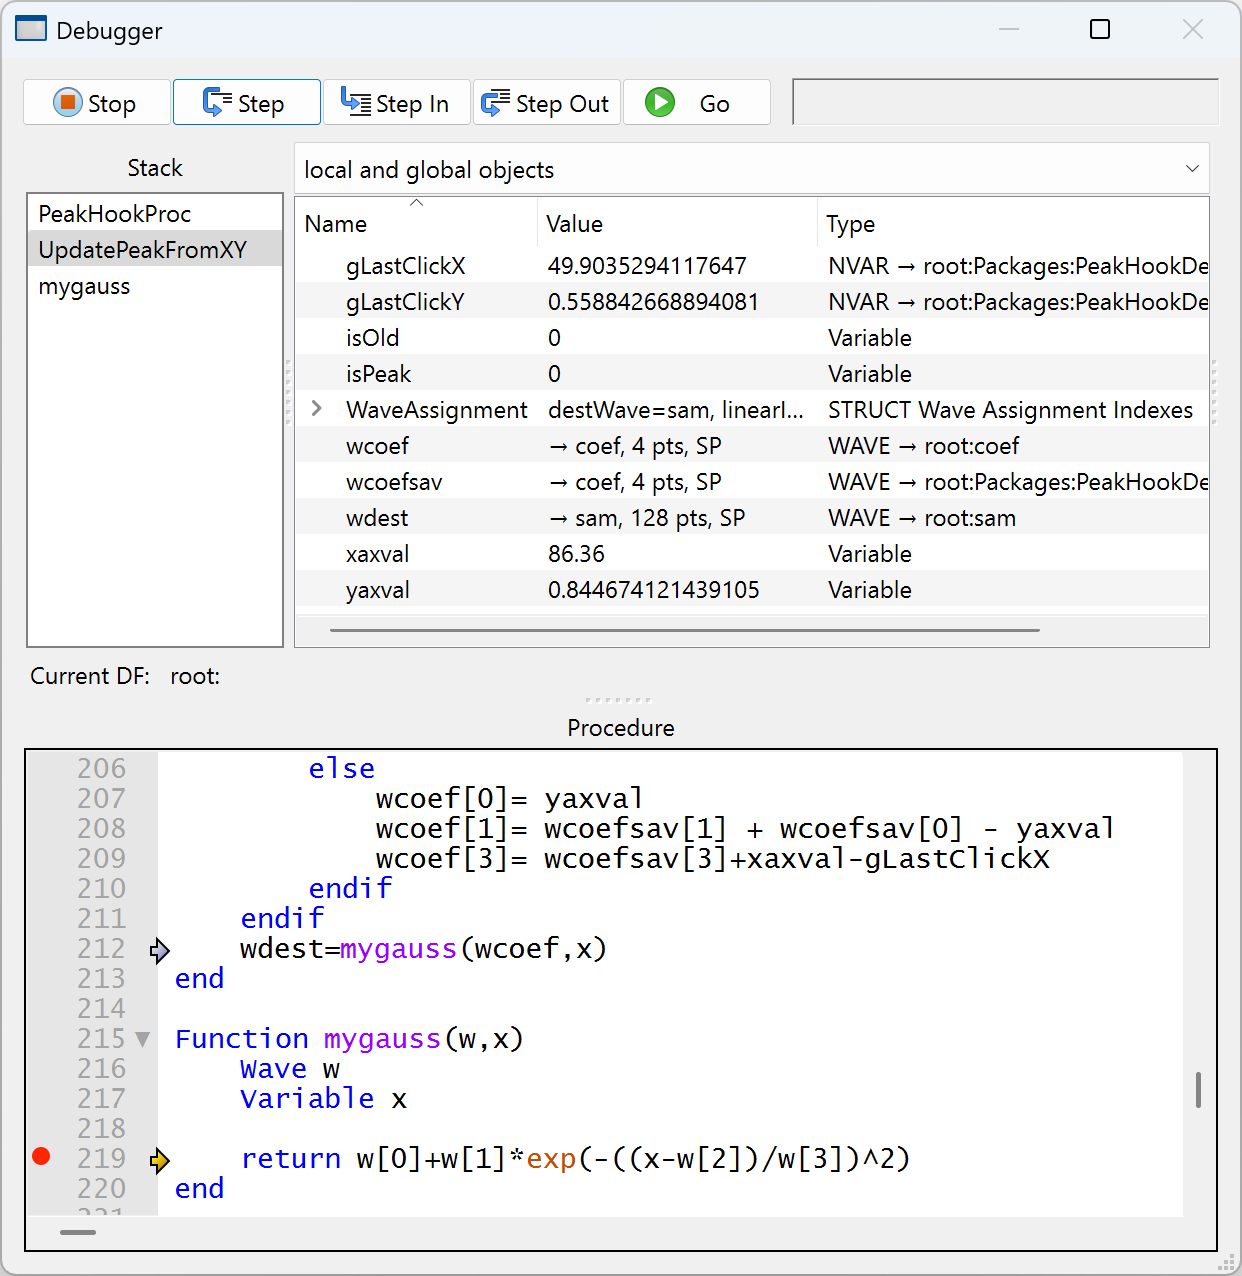
Here we've selected UpdatePeakFromXY, the routine that called mygauss (see the light blue arrow). Notice that the Objects List is showing the objects that are used in UpdatePeakFromXY.
For illustration purposes, the Objects List pop-up menu has been set to show local and global objects and type information.
The Objects List Columns
The Objects List shows either two or three columns, depending on whether the "show variable types" item in the Objects pop-up menu is checked.
Double-clicking a column's header resizes the column to fit the contents. Double-clicking again resizes the column to a default width. Single-clicking a column's header sorts the list by the contents of the clicked column. Clicking again reverses the sort order.
The first column is the local name of the object. The name of an NVAR, SVAR, or WAVE reference is a name local to the macro or function that refers to a global object in a data folder, which may (usually does) have a different name.
The second column is the value of the local object. Double-click the second column to edit numbers in-place, double-click anywhere on the row to "inspect" waves, strings, SVARs or char arrays in structures in the appropriate Inspector.
In the case of a wave, the size and precision of the wave are shown here. The "→" characters mean "refers to". In our example, wcoef is a local name that refers to a (global) wave named coef, which is one-dimensional, has 4 points, and is single precision floating point.
To determine the value of a particular wave element, use an inspector as described under Inspecting Waves, or write an expression like wcoef[2] in the Expressions Inspector.
The optional third column shows what the type of the object is, whether Variable, String, NVAR, SVAR, WAVE, etc. For global references, the full data folder path to the global object is shown.
The Objects Pop-Up Menu
The Objects pop-up menu controls which information is displayed in the Objects List. When debugging a function, it looks like this:
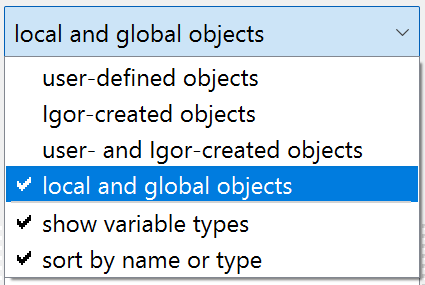
When debugging a macro, proc or window macro, the first two items in the popup menu are unavailable.
Macro Objects
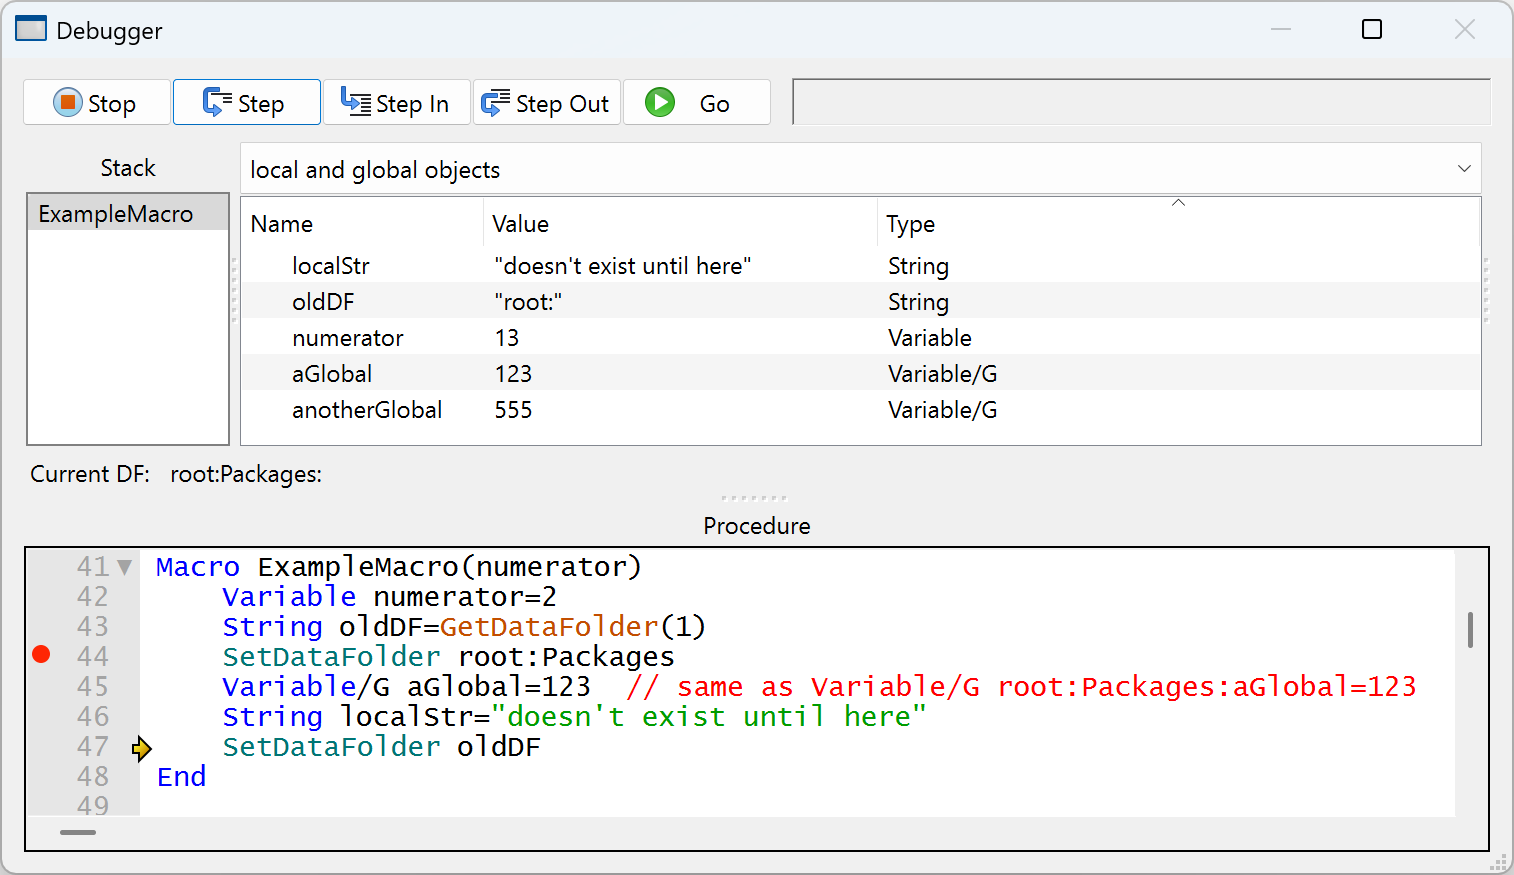
The ExampleMacro below illustrates how objects in Macros, Procs or Window procedures are classified as locals or globals:
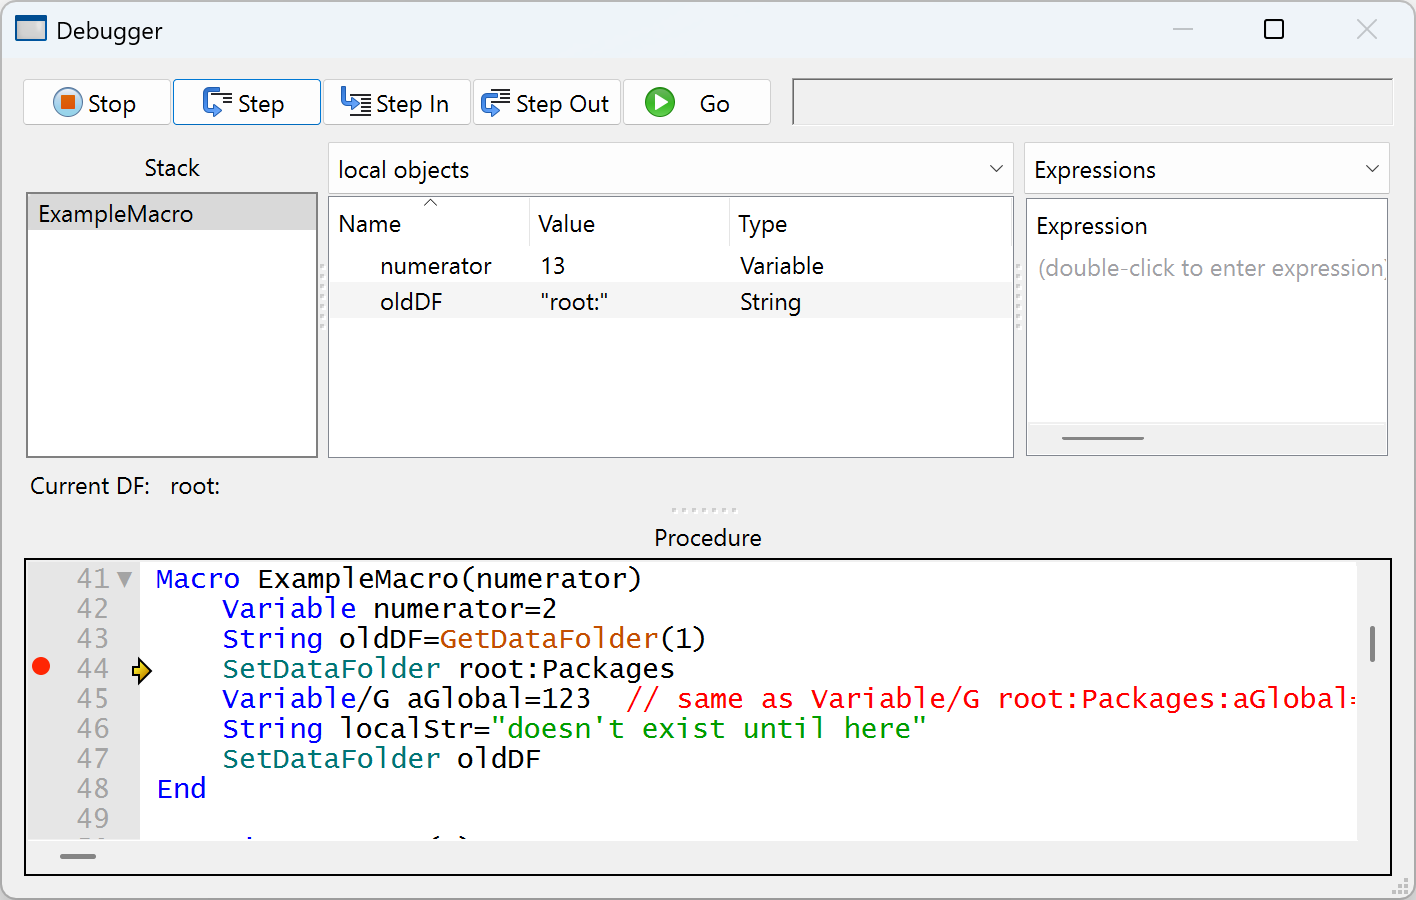
Local objects in macros include all items passed as parameters (numerator in this example), and local Variables and local Strings (oldDF) whose definitions have been executed, and Igor-created local Variables and Strings created by operations such as WaveStats after the operation has been executed. Note that localStr isn't listed, because the command has not yet executed.
Global variables in macros include all items in the current data folder, whether they are used in the macro or not. If the data folder changes because of a SetDataFolder operation, the list of global variables also changes. Note that there are no NVAR, SVAR, WAVE or STRUCT references in a macro.
Function Objects
The SlowSumWave function example below illustrates how different kinds of objects in functions are classified:
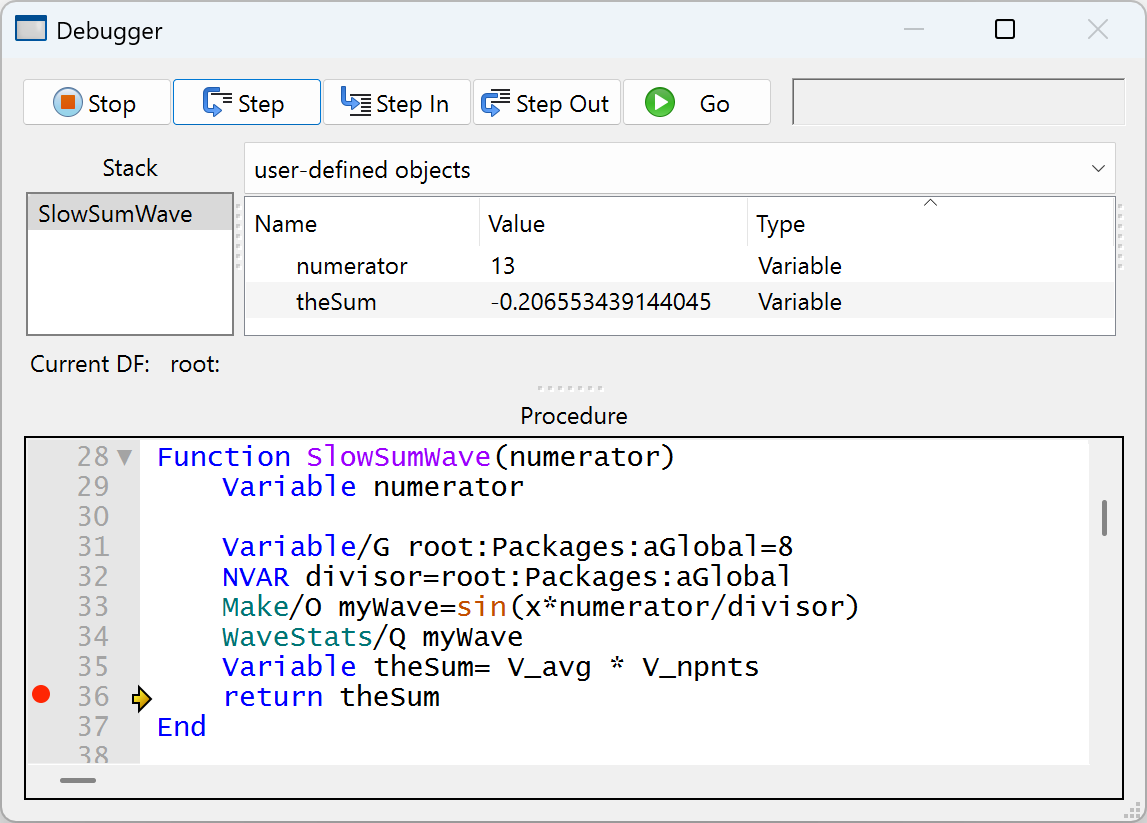
User-defined objects in functions include all items passed as parameters (numerator in this example) and any local strings and variables (like theSum).
Local objects exist while a procedure is running, and cease to exist when the procedure returns; they never exist in a data folder like globals such as waves do.
NVAR, SVAR, WAVE, Variable/G and String/G references point to global objects, and, therefore, aren't listed as user-defined (local) objects, though they do have local names.
Use "Igor-created objects" to show local objects that Igor creates for functions when they call an operation or function that returns results in specially-named variables or strings. The WaveStats operation, for example, defines V_adev, V_avg, and other variables to contain the statistics results:
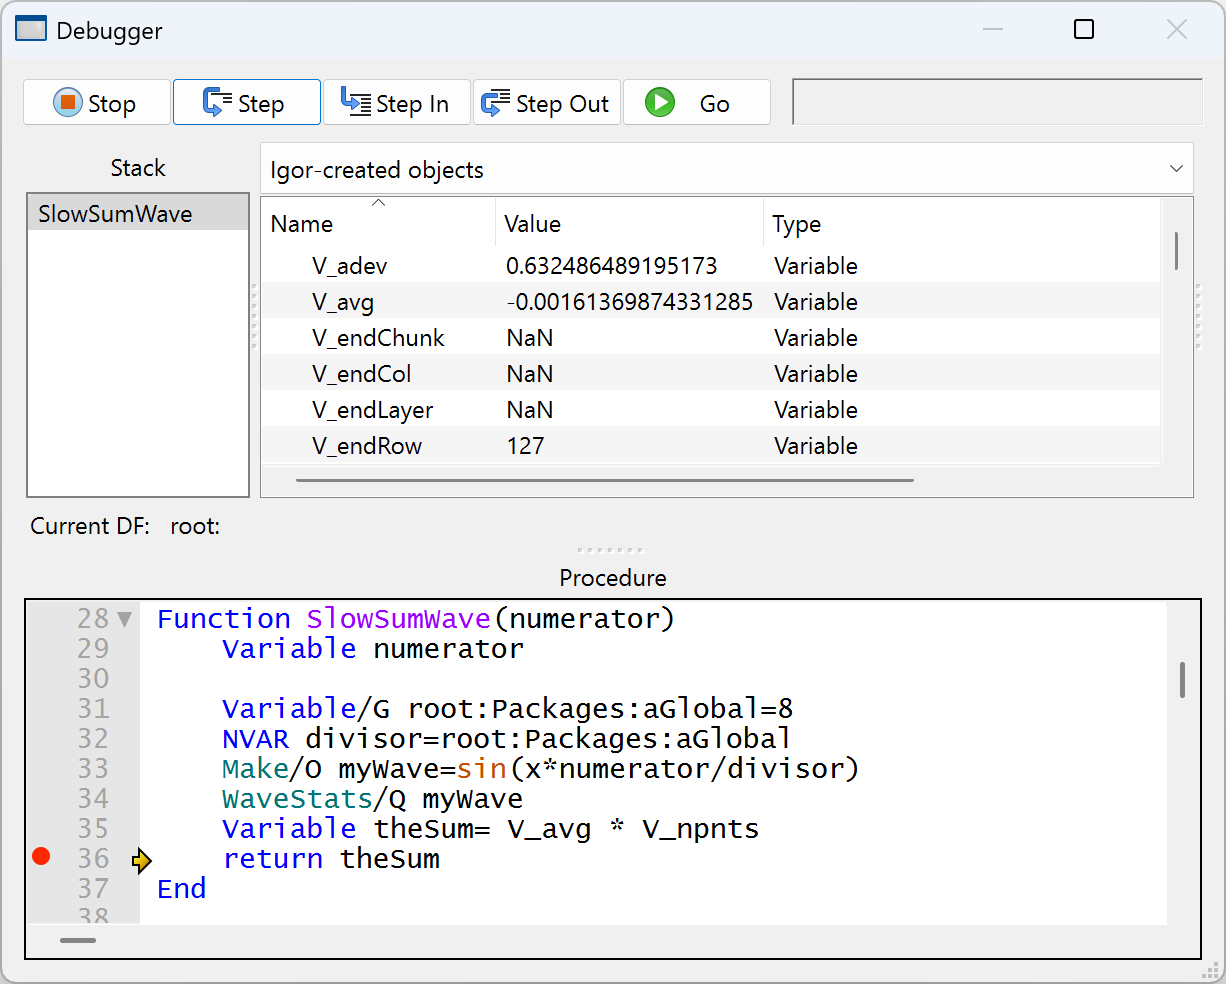
The "user- and Igor-created objects" menu item shows both kinds of local variables.
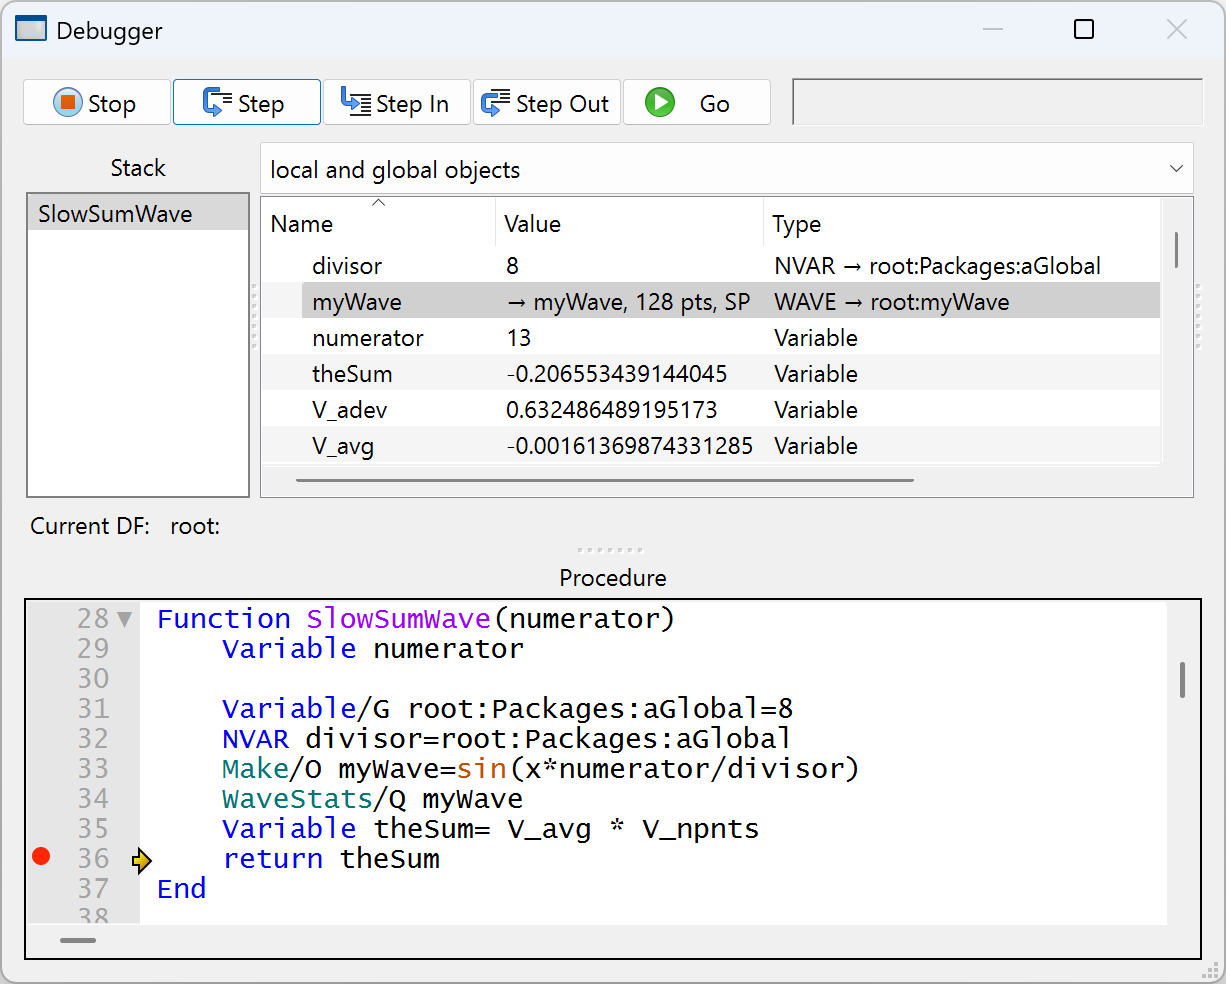
The "local and global objects" item shows user-created local objects, most Igor-created local objects, and references to global Variables, Strings, and waves through NVAR, SVAR, and WAVE references:
Function Structures
The elements of a structure (see "Structures in Functions") are displayed in tree form in the Objects "list". Click the triangles to expand or collapse a node in the structure, or double-click the row:
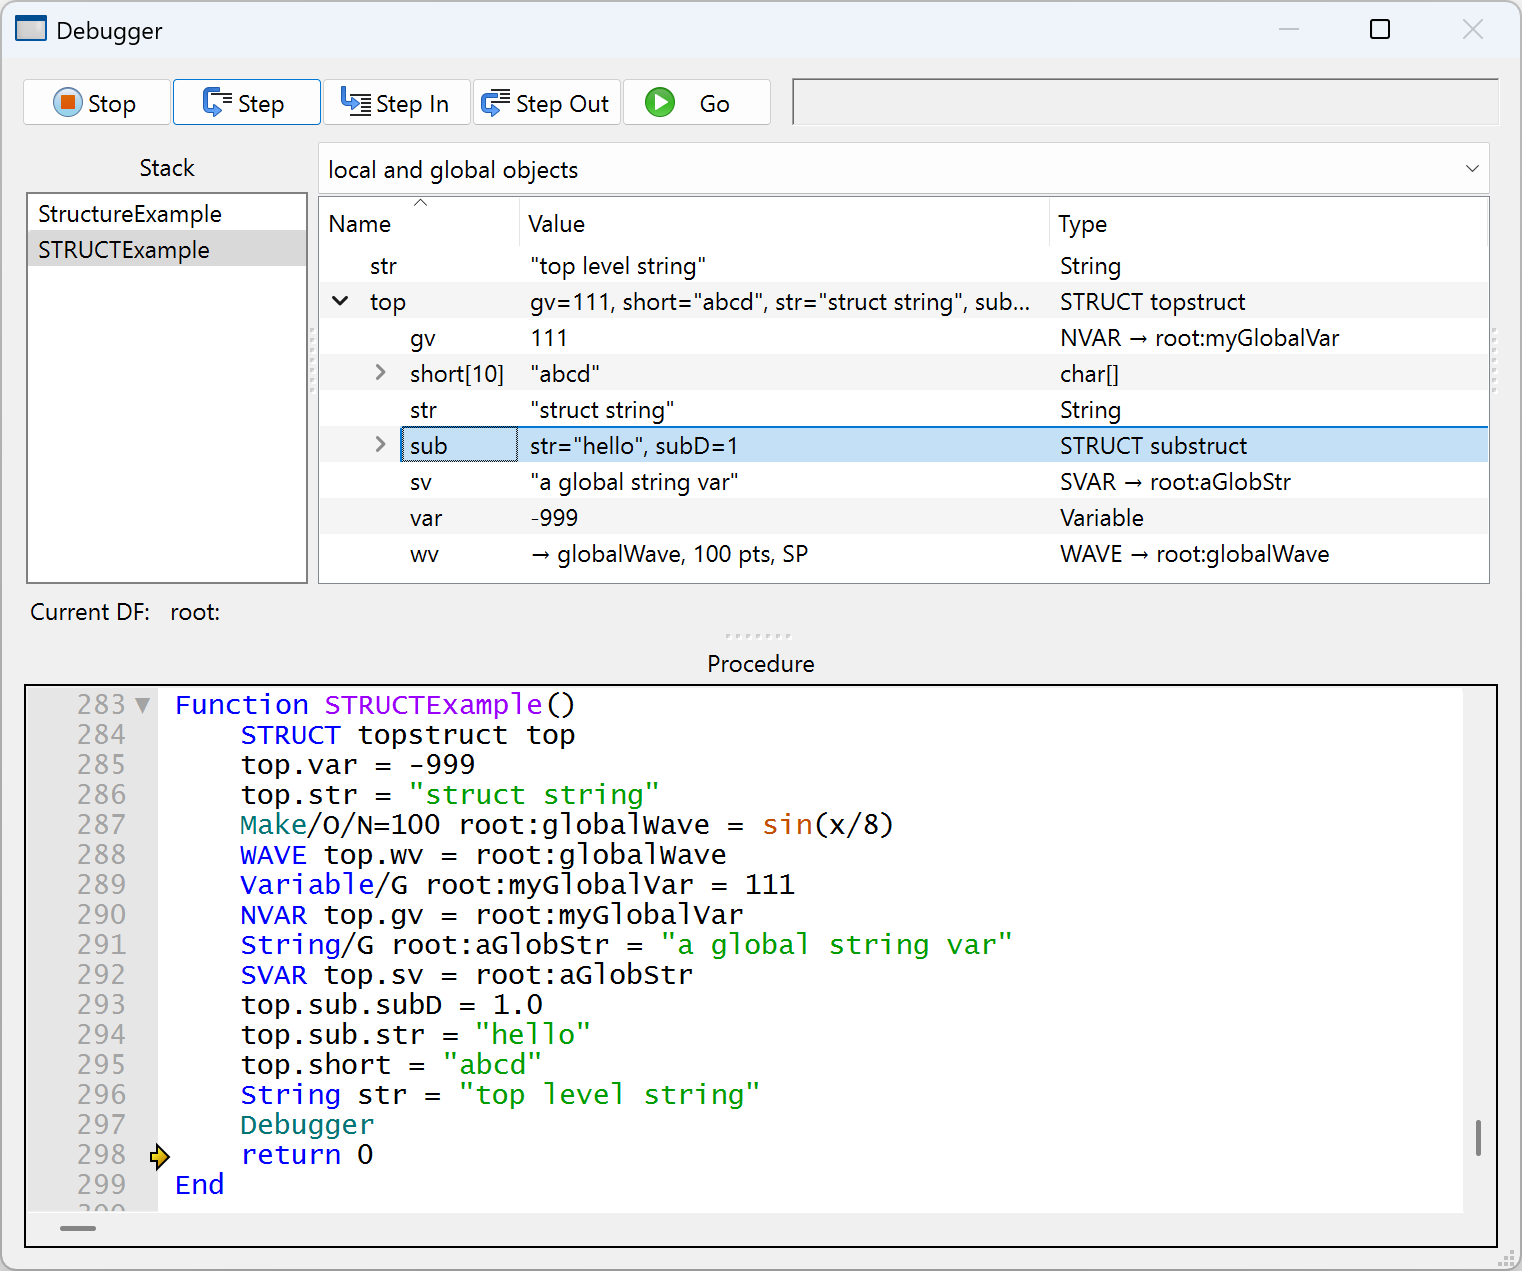
Double-clicking a WAVE element (such as top.wv) will send it to the Wave Inspector (either a table or graph, depending on what is checked in the Inspector popup):
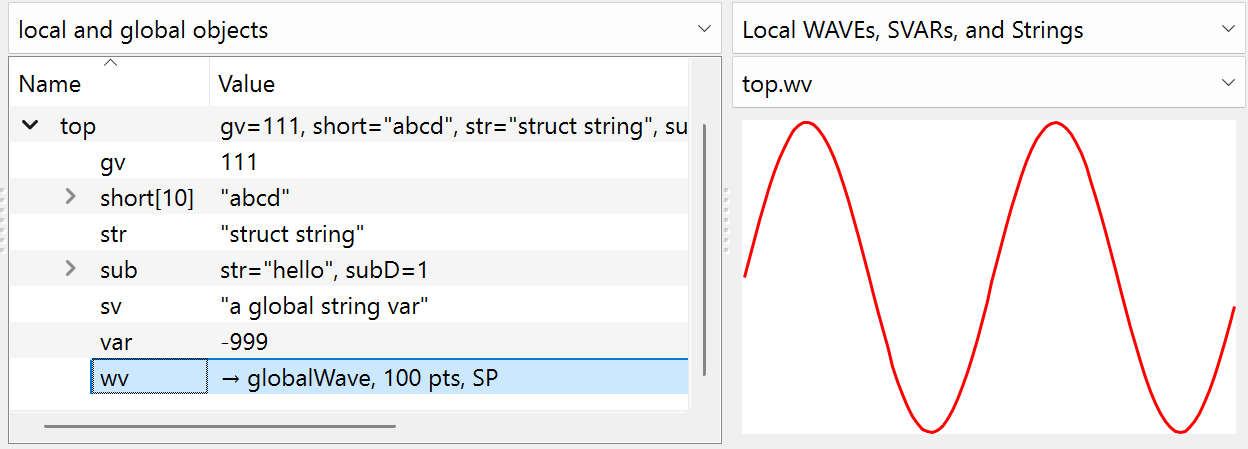
(If the graph or table inspector is not showing, it may have been hidden; drag the inspector divider to the left from its hidden position at the far right of the debugger window.)
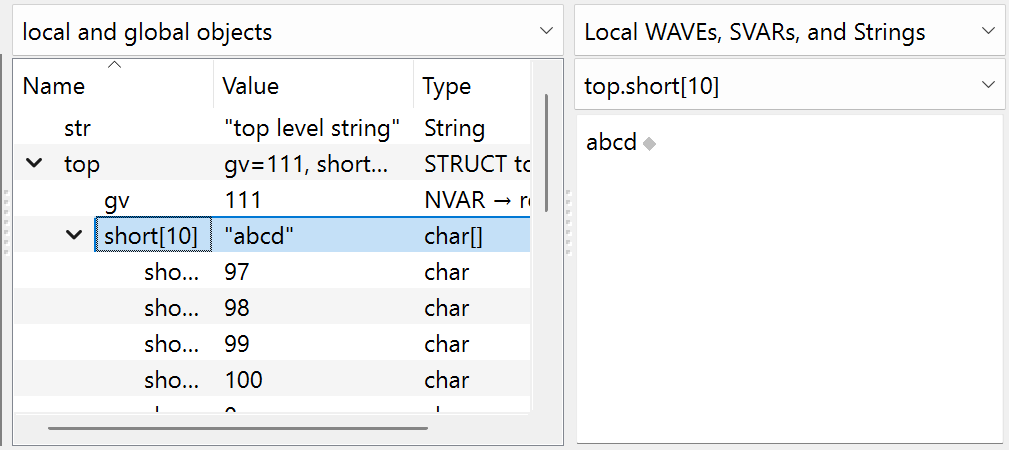
Double-clicking a String element or char array (such as top.short) will send it to the String Inspector:
Wave Assignment Debugging
The execution state of a waveform assignment can be examined in the WaveAssignment structure that the debugger fabricates in the routine where the assignment is made.
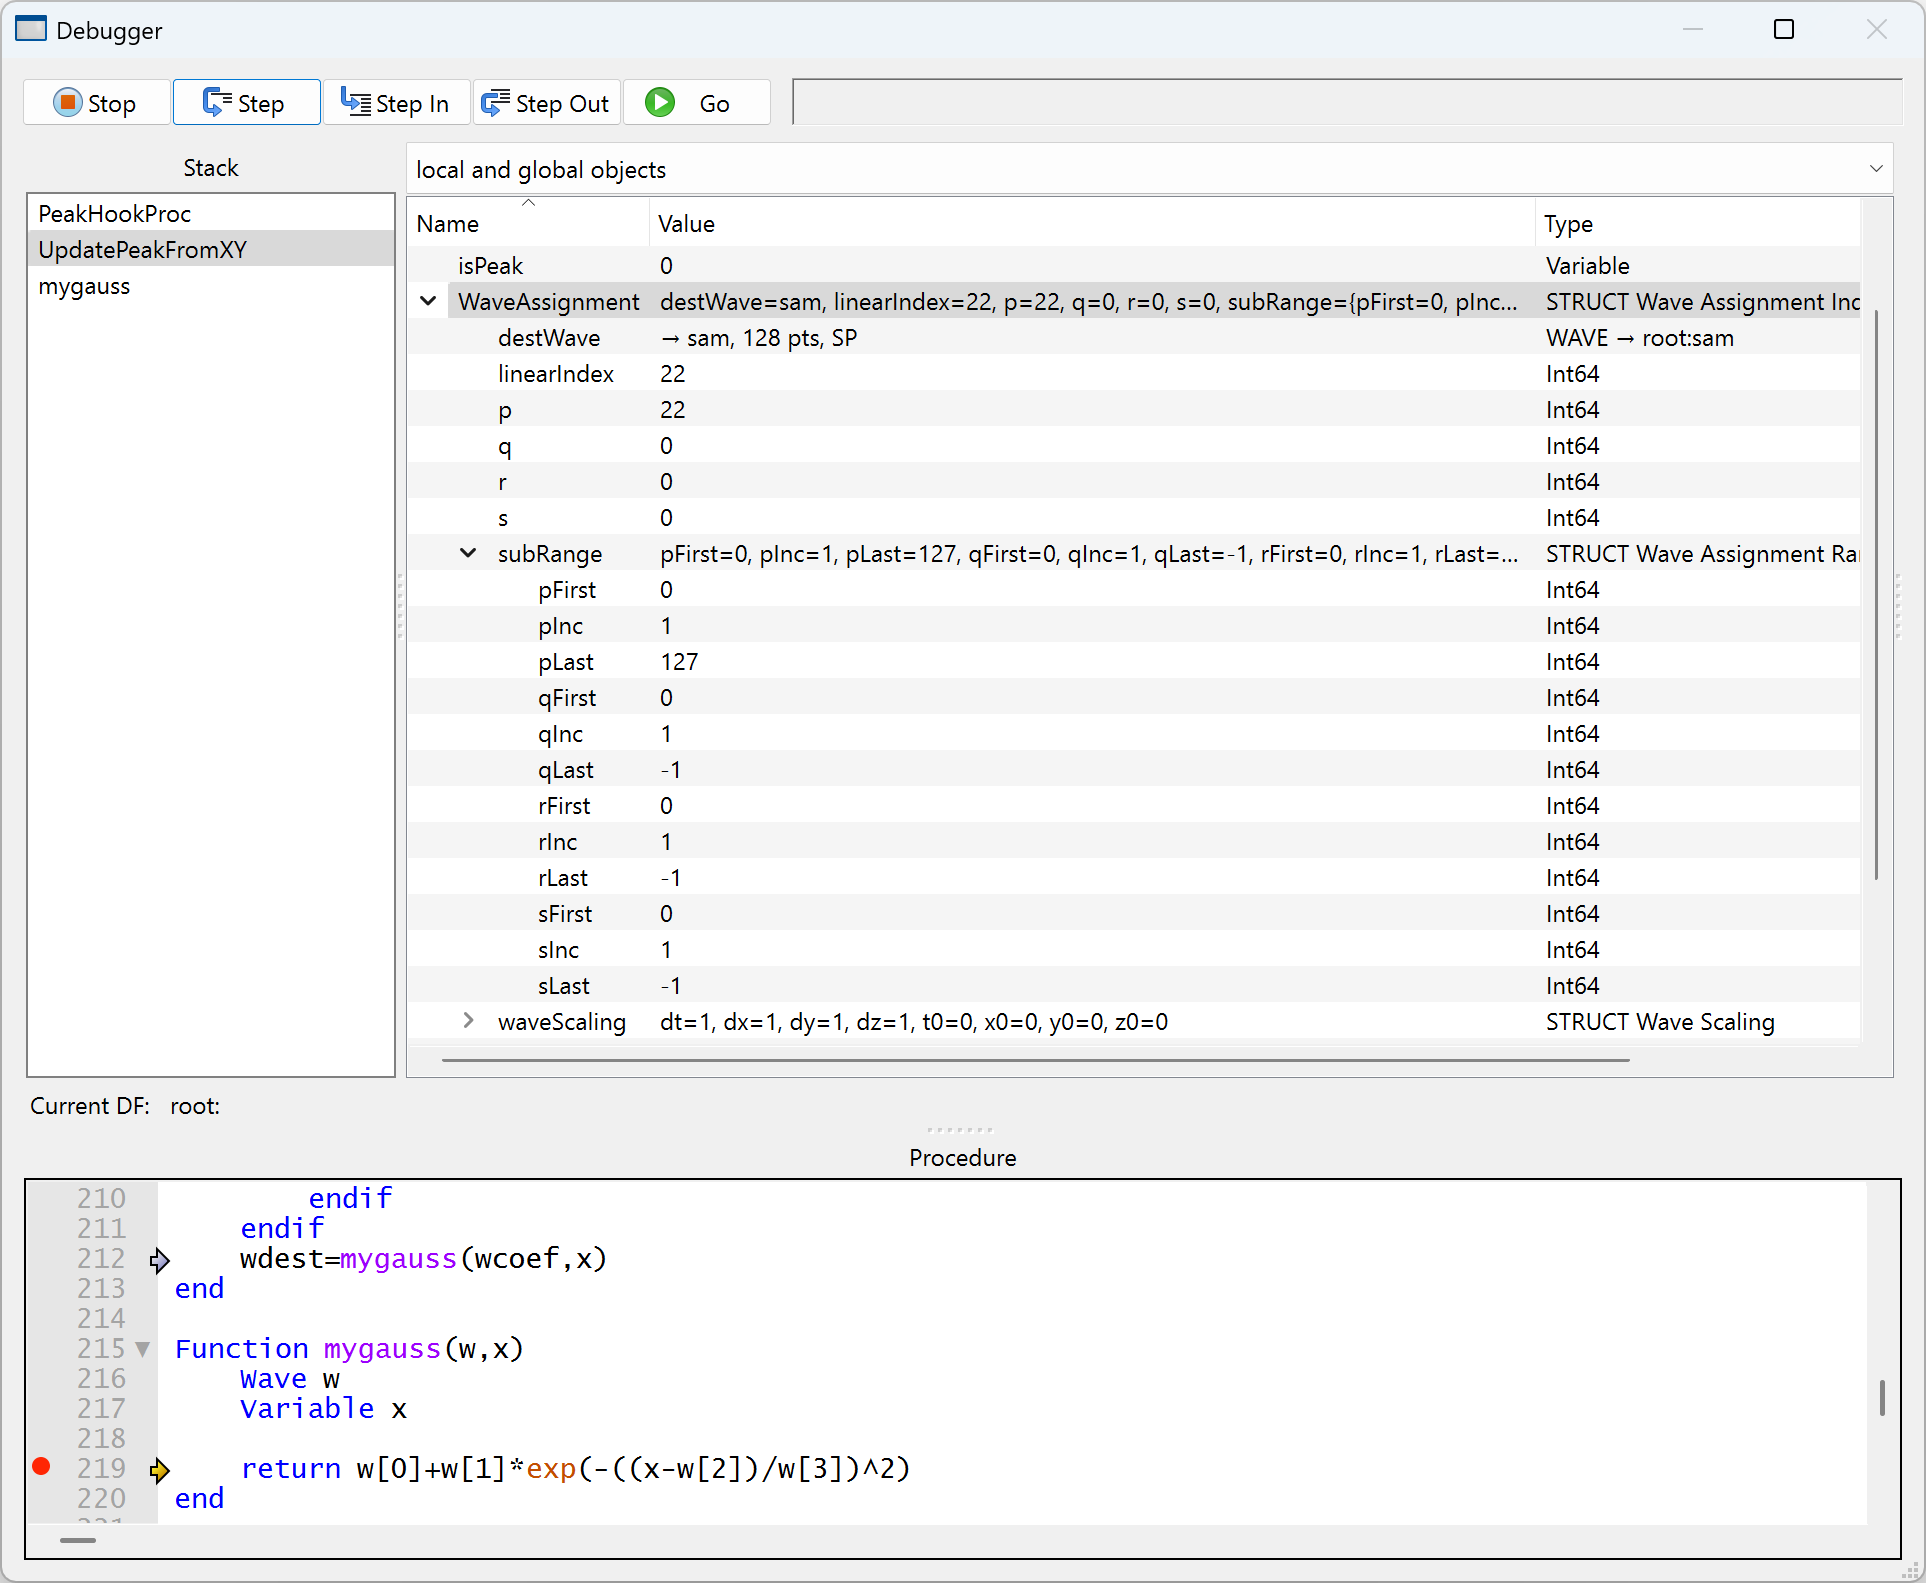
In this example, the line:
wdest=mygauss(wcoef,x)
is the waveform assignment statement that is currently executing in the UpdatePeakFromXY function (as indicated by the blue arrow).
UpdatePeakFromXY is calling the mygauss user-defined function to set each of the 128 values of the destination wave (a WAVE wdest reference to the global wave named "sam").
The example WaveAssignment structure is showing that sam[22] is being assigned to.
The WaveAssignment structure shows:
| destWave | The wave being assigned to. | |
| linearIndex | The point in the wave being assigned to, when viewed as a 1D wave. | |
| p, q, r, s | Indexes of the current row, column, layer, and chunk of the point in the wave being assigned to, when viewed as a multi-dimensional wave. | |
| subRange | Start, increment, and ending indexes of the row, column, layer, and chunk dimensions. | |
| If the the last index is -1, that indicates the corresponding dimension is not relevant to the assignment. The example wave is 1D, so qLast = -1 is indicating that the column dimension is not relevant.. | ||
| waveScaling | Wave scaling for each dimension of the wave, expressed as a starting and increment value for each dimension: | |
| x0, dx = row scaling, DimOffset(destWave,0), DimDelta(destWave,0) | ||
| y0, dy = column scaling, DimOffset(destWave,1), DimDelta(destWave,1) | ||
| z0, dz = layer scaling, etc | ||
| t0, dt = chunk scaling | ||
See Waveform Arithmetic and Assignment for more information.
The Current Data Folder
The "Current DF" displays the path to the current data folder. The data folder value can be selected and copied. See Data Folders for more information about data folders.
Graph, Table, String, Symbolic Paths, and Expressions Inspectors
One of the Wave, String, Symbolic Path, or Expressions Inspectors is visible to right side of the Objects List. This pane is hidden when the divider between the pane and the objects list is dragged all the way to the right. Drag the divider to the left to show the pane. You may need to widen the window to make room.
Use the popup to select the Inspector you want.
| Pop-up Menu Selection | Pane Contents |
|---|---|
| Local WAVEs, SVARs, and Strings | A list of these things in the selected function. References to free waves are also listed here, as are elements in a STRUCT that are "inspectable", including char arrays which can be viewed as if they were Strings. |
| Local Strings | A list of Strings local to the selected function, macro or proc. |
| Expressions | Numeric or string expressions which are evaluated in the context of the selected function or macro. |
| Global Waves | A popup wave selector to display any wave in a global data folder. Free waves are not listed here. |
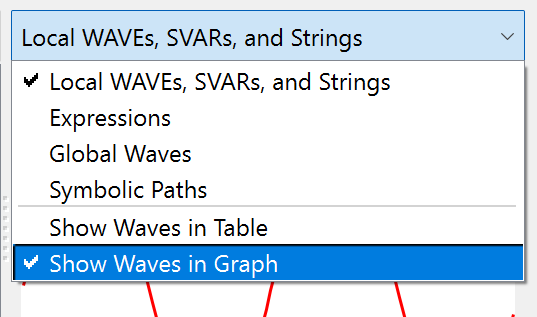
| Show Waves in Table | Waves will be displayed in a table or graph, |
| Show Waves in Graph | depending on which one of these two is checked. |
Expressions Inspector
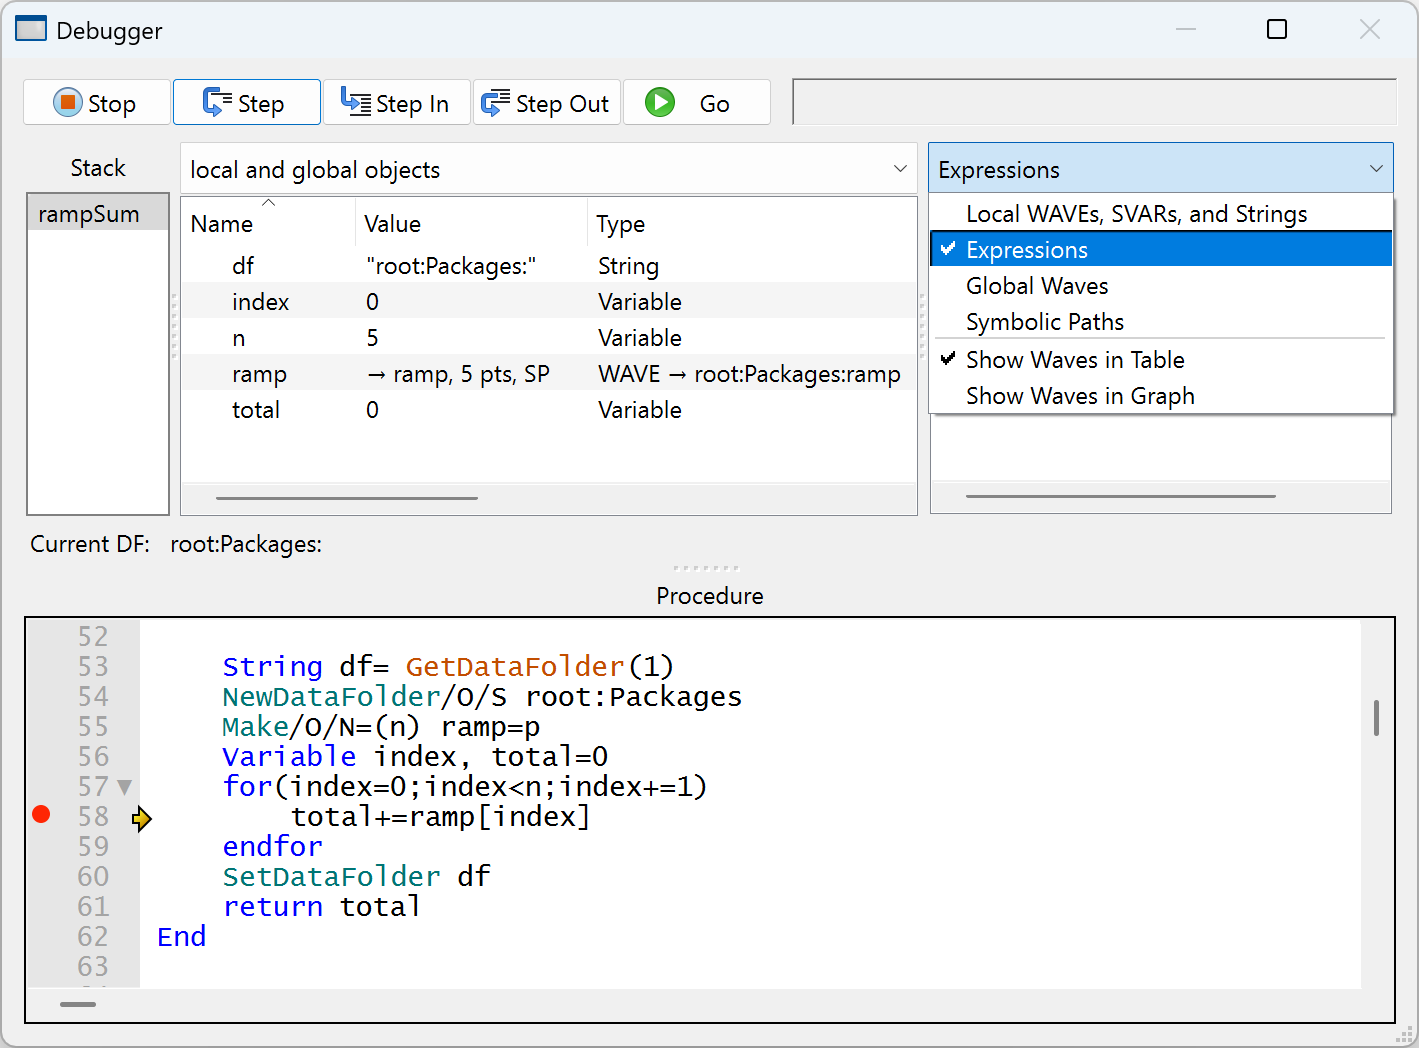
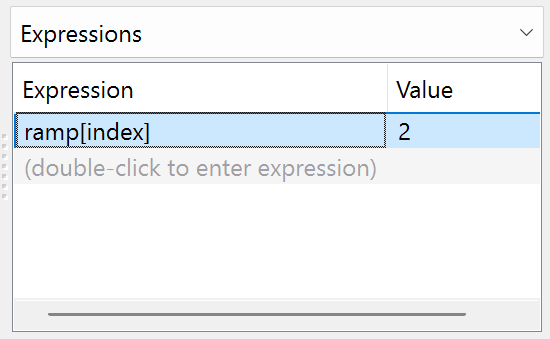
Selecting "Expressions" from the inspector popup shows a list of Expressions and their values (initially blank):
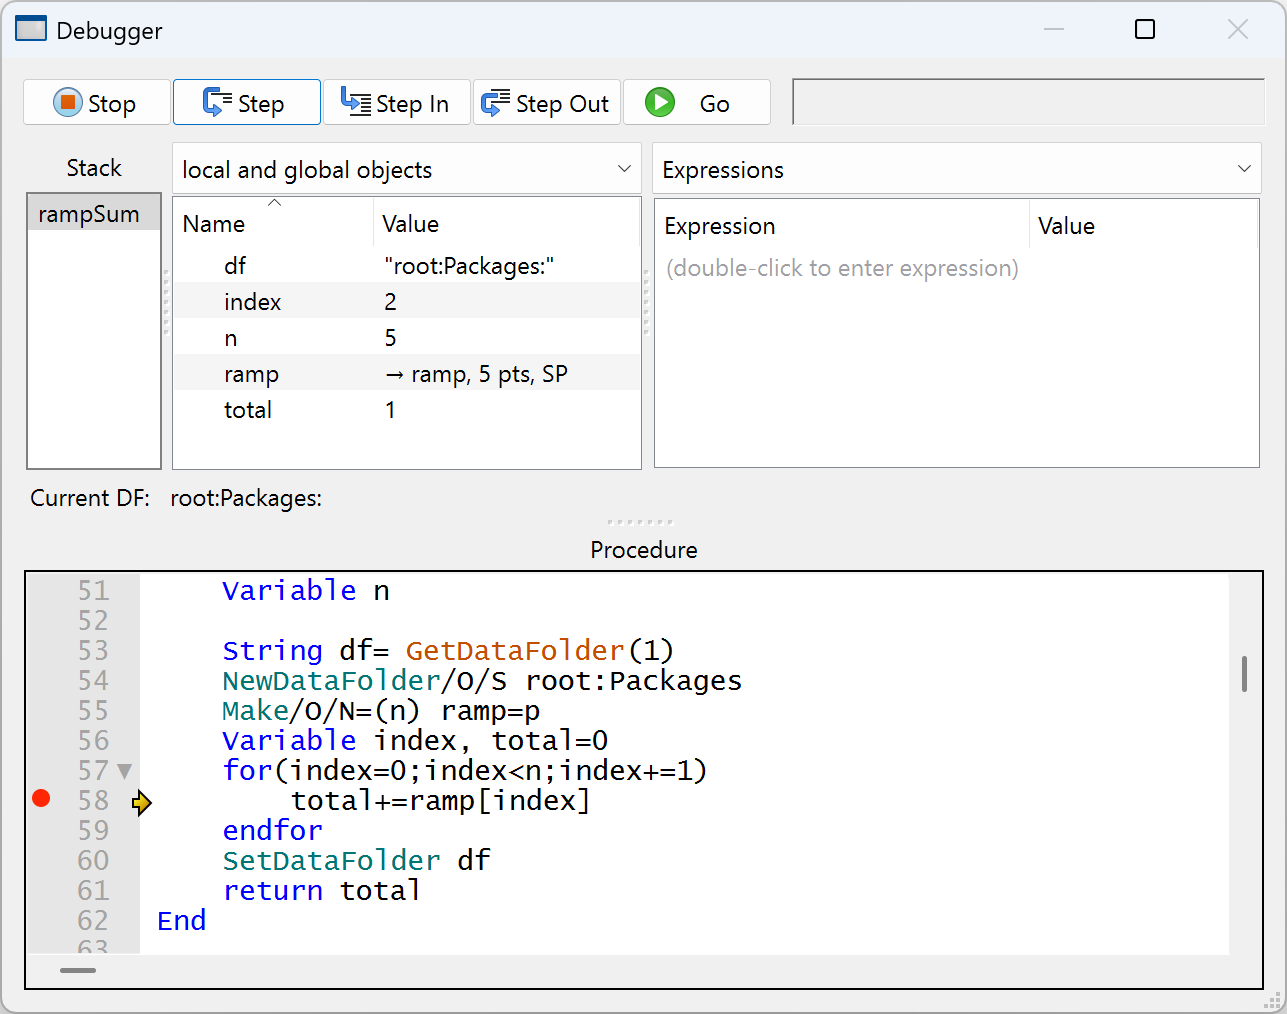
Replace the "(dbl-click to enter expression)" invitation by double-clicking it, typing a numeric or string expression, and pressing Return:
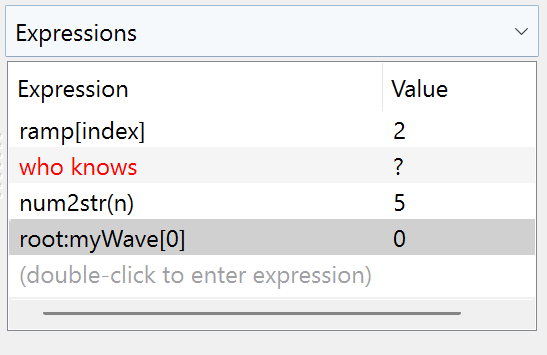
Adding an expression adds a row at the end of the list that can be double-clicked to enter another expression. You can edit any of the expressions by double-clicking and typing.
The expression can be removed by selecting it and pressing Delete or Backspace.
The result of the expression is recomputed when stepping through procedures. The expressions are evaluated in the context of the currently selected procedure.
Global expressions are evaluated in the context of the current data folder, though you can specify the data folder explicitly as in the example below.
If an expression is invalid the result is shown as "?" and the expression is changed to red:
The expressions are discarded when a new Igor experiment is opened or when Igor quits.
Inspecting Waves
You can "inspect" (view) the contents of a wave in either a table or a graph. They aren't full-featured tables or graphs, as there are no supporting dialogs for them. You can change their properties using contextual menus.
Select the Wave to be inspected by one of three methods:
-
Choose "Global Waves", and then choose a wave from the popup wave browser.
-
Choose "Local WAVEs, SVARs, and Strings", and then choose a wave from among the objects listed.
-
Double-click any WAVE reference in the Objects list.
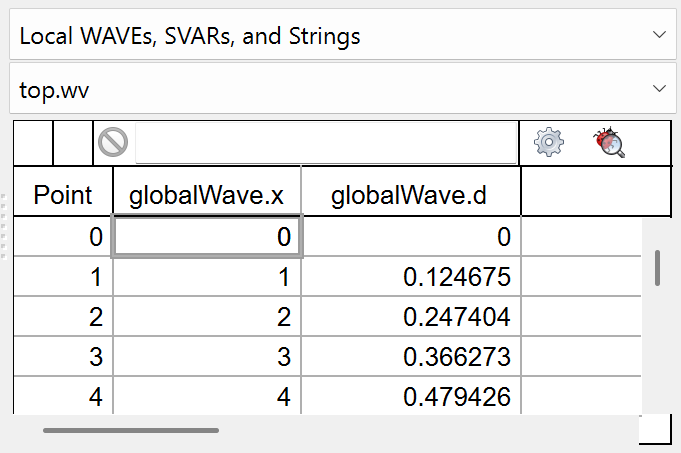
Inspecting Waves in a Table
You can edit the values in a wave using the table, just like a regular table. With the contextual menu you can alter the column format, among other things.
Inspecting Waves in a Graph
You can view waves in a Graph. With the contextual menu, you can choose to show or hide the axes and change display modes.
Two-dimensional waves are displayed as an image plot.
Inspecting Strings
Select a String or char array to be inspected by two methods:
-
Choose "Local WAVEs, SVARs, and Strings", and then choose a String, SVAR or char array from among the objects listed.
-
Double-click any String, SVAR or char array in the Variables list.
The Procedure Pane
The procedure pane contains a copy of the procedure window of the routine selected in the Stack List. You can set and clear breakpoints in this pane just as you do in a procedure window, using the breakpoint margin and the right-click menu.
A very useful feature of the debugger is the automatic text expression evaluator that shows the value of a variable or expression under the cursor. The value is displayed as a tooltip. This is often faster than scrolling through the Variables List or entering an expression in the Expressions List to determine the value of a variable, wave, or structure member reference.
The value of a variable can be displayed whether or not the variable name is selected. To evaluate an expression such as "wave[ii]+3", the expression must be selected and the cursor must be over the selection.
The debugger won't evaluate expressions that include calls to user-defined functions; this prevents unintended side effects (a function could overwrite a wave's contents, for example). You can remove this limitation by creating the aptly-named global variable root:V_debugDangerously and setting it to 1.
After You Find a Bug
Editing code in the debugger window is disabled because the code is currently executing. Tracking down the routine after you've exited the debugger is easy if you follow these steps:
-
Copy the name of the routine from the procedure code to the clipboard.
-
Exit the debugger.
-
Paste the name of the routine to the command line. Do not execute it.
-
Right-click the name, and choose
Go to <routine name>from the pop-up menu.
Now the selected routine will be visible in the top procedure window, where you can edit it.
Debugging ThreadSafe Code
The Igor debugger cannot be used with threadsafe functions, unless they are running in the main thread.
The debugger does not break on breakpoints in threadsafe functions, unless they are running in the main thread.
The debugger does not allow you to step into a threadsafe function, unless it is running in the main thread.
These restrictions apply even if you call a threadsafe function from a non-threadsafe function.
The main technique for debugging threadsafe code running in a preemptive thread is the use of print statements. See Debugging With Print Statements.
You can use the debugger on functions that normally run in a preemptive thread by temporarily disabling multithreading by executing:
SetIgorOption DisableThreadSafe = 1 // Disable multithreading
This causes Igor to recompile all procedures and to ignore the Threadsafe and MultiThread keywords. You can then debug procedures using the debugger. When you are finished, re-enable multithreading by executing:
SetIgorOption DisableThreadSafe = 0 // Re-enable multithreading